. 2017 Jun 6;8(6):1727-1742.
doi: 10.1016/j.stemcr.2017.05.017.

A Highly Efficient Human Pluripotent Stem Cell Microglia Model Displays a Neuronal-Co-culture-Specific Expression Profile and Inflammatory Response

Affiliations

A Highly Efficient Human Pluripotent Stem Cell Microglia Model Displays a Neuronal-Co-culture-Specific Expression Profile and Inflammatory Response

Walther Haenseler et al. Stem Cell Reports. .

Abstract

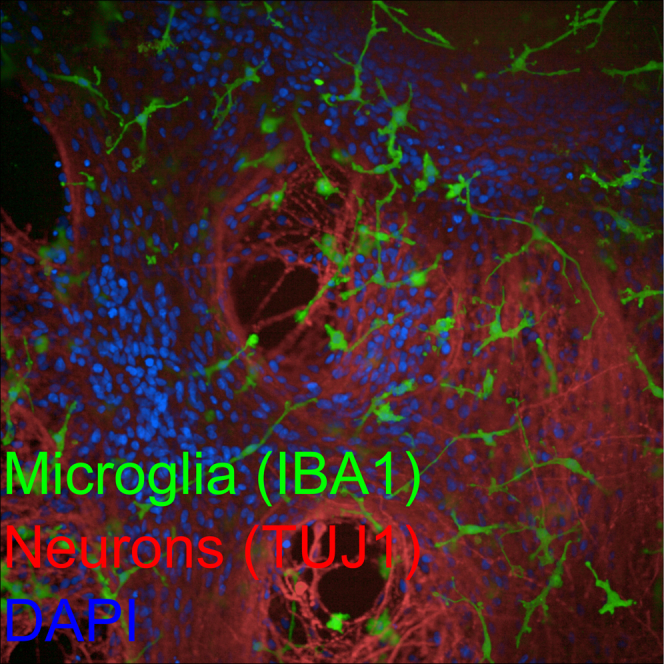
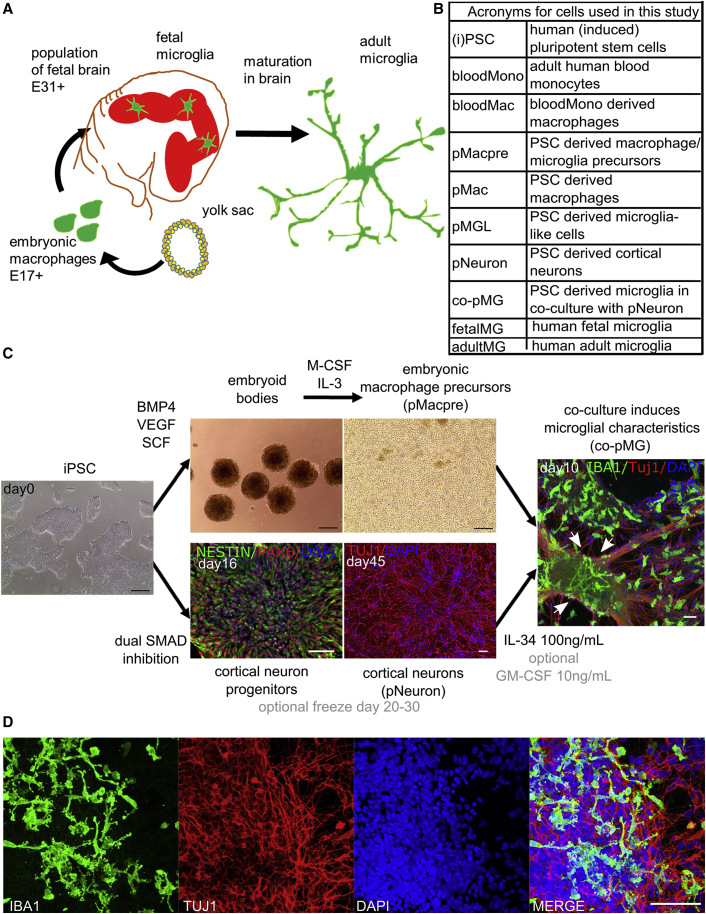
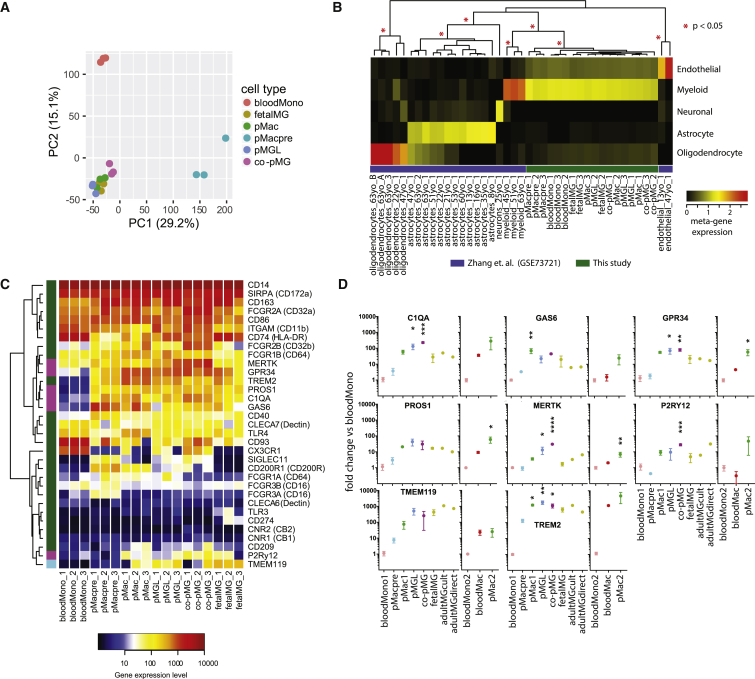
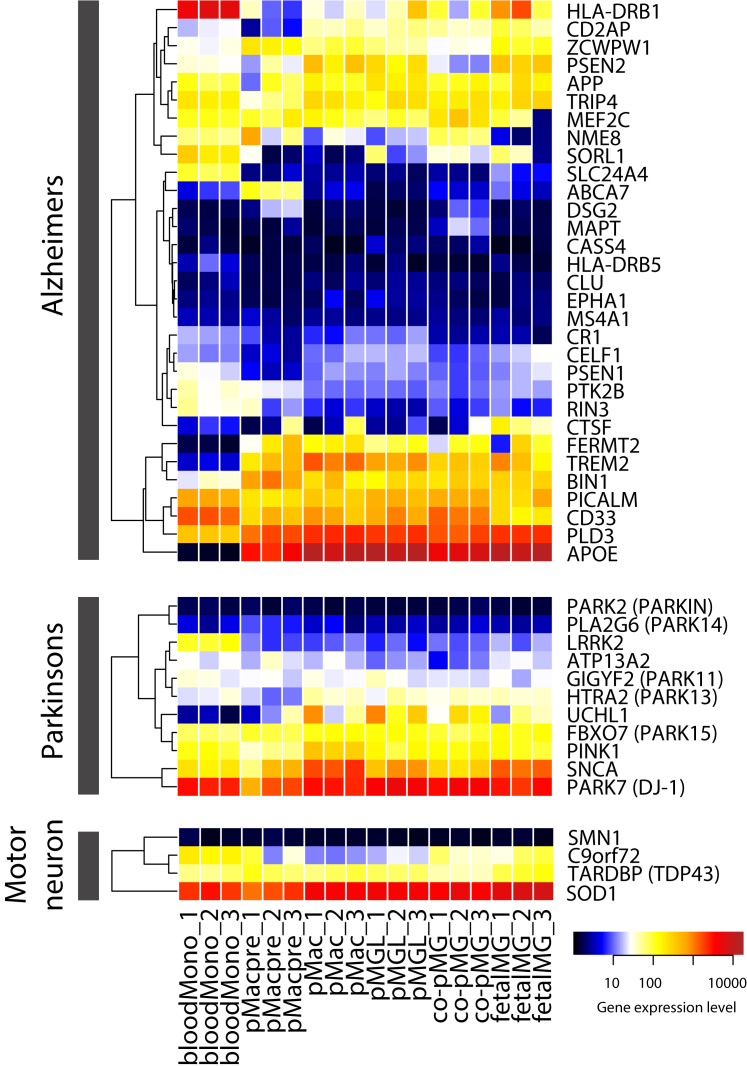
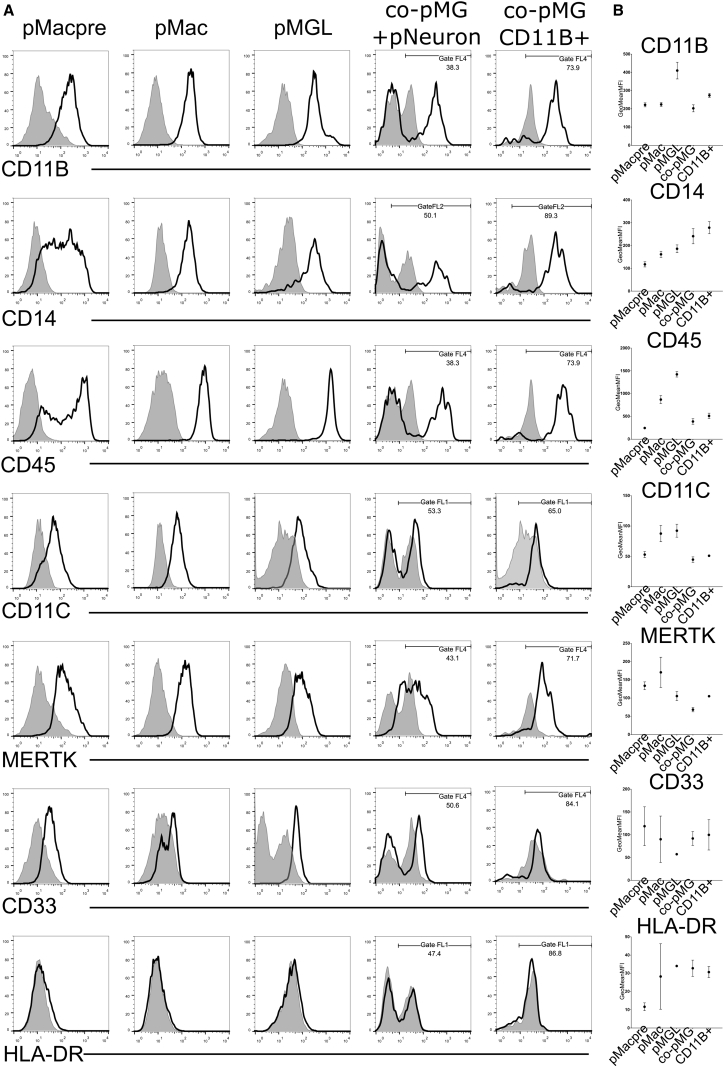
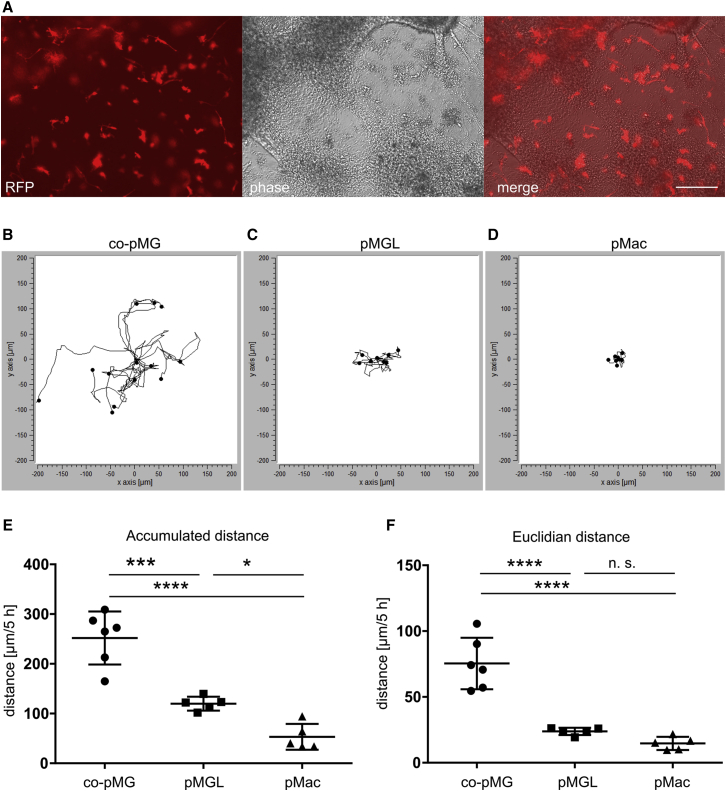
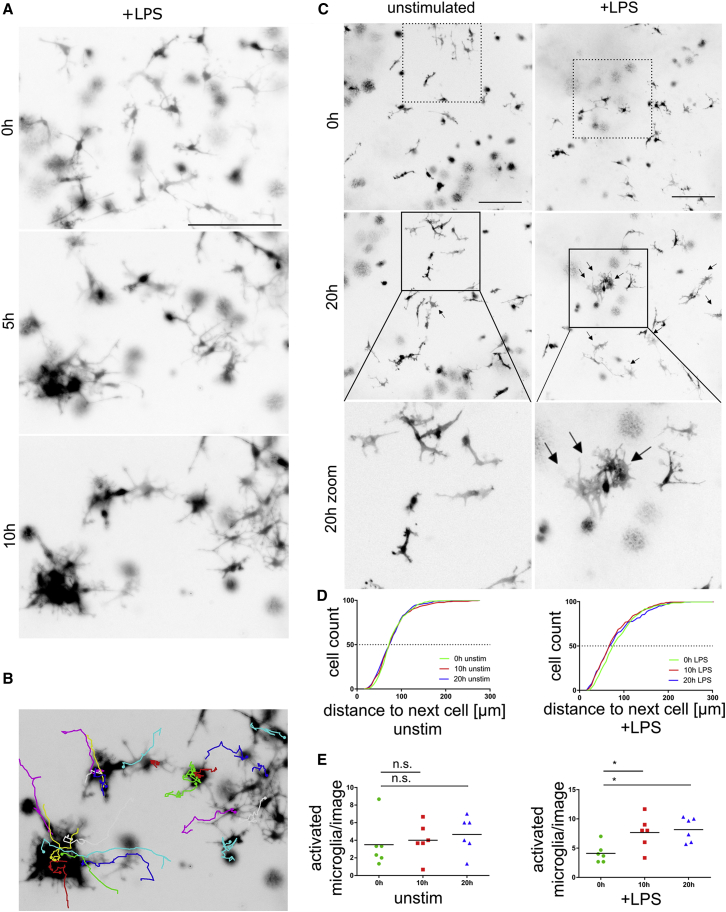
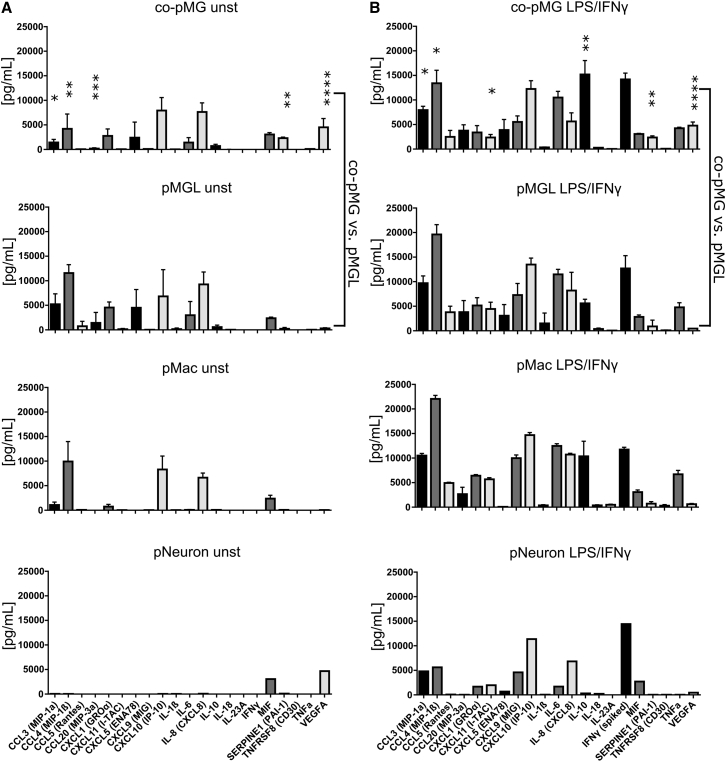
Microglia are increasingly implicated in brain pathology, particularly neurodegenerative disease, with many genes implicated in Alzheimer's, Parkinson's, and motor neuron disease expressed in microglia. There is, therefore, a need for authentic, efficient in vitro models to study human microglial pathological mechanisms. Microglia originate from the yolk sac as MYB-independent macrophages, migrating into the developing brain to complete differentiation. Here, we recapitulate microglial ontogeny by highly efficient differentiation of embryonic MYB-independent iPSC-derived macrophages then co-culture them with iPSC-derived cortical neurons. Co-cultures retain neuronal maturity and functionality for many weeks. Co-culture microglia express key microglia-specific markers and neurodegenerative disease-relevant genes, develop highly dynamic ramifications, and are phagocytic. Upon activation they become more ameboid, releasing multiple microglia-relevant cytokines. Importantly, co-culture microglia downregulate pathogen-response pathways, upregulate homeostatic function pathways, and promote a more anti-inflammatory and pro-remodeling cytokine response than corresponding monocultures, demonstrating that co-cultures are preferable for modeling authentic microglial physiology.

Keywords: Alzheimer's disease; Parkinson's disease; cortical neurons; human; iPSC; induced pluripotent stem cell; macrophage; microglia; neurodegeneration; neuroinflammation.


Figures

None
Graphical abstract
Figure 1
Figure 1
iPSC-Derived Microglia-Neuron Co-culture Recapitulates Microglial Development in the Embryo (A) Human microglia originate from the yolk sac as primitive macrophages, migrating into the fetal brain before the formation of the blood-brain barrier, and completing their maturation in the brain environment. (B) Acronyms used for the cell types in this study. (C) Co-culture of iPSC embryonic macrophages and iPSC-cortical neurons with IL-34 (and, optionally, low level GM-CSF) recapitulates development of microglia in the brain. White arrows: highly ramified cells most evident in dense neuron clusters. (D) Ramified microglia after 2 weeks of co-culture. Black scale bars, 200 μm; white scale bars, 50 μm. See also Figures S1 and S2; Movie S1.
Figure 2
Figure 2
iPSC Co-culture Microglia Express Consensus Microglia Markers Illumina HT12v4 transcriptome analysis of blood monocytes (bloodMono), iPSC-derived macrophage precursors (pMacpre), iPSC-derived macrophages (pMac), iPSC macrophages in microglia medium (pMGL), iPSC co-culture microglia isolated from co-culture (co-pMG), and freshly isolated human primary fetal microglia (fetalMG) (three genetic backgrounds each). (A) Principal component (PC) analysis of samples based on protein coding gene expression. Numbers in parentheses indicate the percentage variance. (B) Cell type analysis. Samples are hierarchically clustered by their expression of metagenes defined by non-negative matrix factorization from a previously published expression dataset for human cortex myeloid cells, cortical oligodendrocytes, astrocytes, neurons, and endothelial cells (Zhang et al., 2016). Red asterisks indicate significant clusters (pvclust, approximately unbiased). (C) Expression of consensus human microglia/monocyte markers. Genes found by Melief et al. (2012) to be highest in microglia are highlighted in green on left-hand bar; six genes identified as being differentially expressed in microglia versus blood monocytes by Butovsky et al. (2014) are magenta, and TMEM119 (Bennett et al., 2016), is azure. Rows are hierarchically clustered. (D) Expression of key microglia markers by qRT-PCR. Fold change was calculated using the ΔΔCT method, with 18S RNA as an endogenous control and normalization to bloodMono. Three genetic backgrounds for all conditions, as per transcriptome samples, with additional comparison with cultured adult human microglia (n = 1, with technical PCR triplicates) and with directly isolated/processed adult human microglia (n = 1, technical PCR triplicates). A second set of bloodMono were also differentiated to macrophages and assessed for these markers, alongside a second batch of pMac (three genetic backgrounds each). Mean ± SEM, one-way ANOVA, Dunnett's multiple comparisons test versus bloodMono. p < 0.05, ∗∗p < 0.01, ∗∗∗p < 0.001, ∗∗∗∗p < 0.0001. See Figures S3 and S4 for further transcriptomic analyses.
Figure 3
Figure 3
Expression of Genes Associated with Major Neurodegenerative Disorders Samples and expression dataset as per Figure 2.
Figure 4
Figure 4
iPSC Co-culture Microglia Express Relevant Protein Markers (A) Flow cytometry of cells differentiated from one line (SFC856-03-04, black line is surface marker, filled gray area is isotype control). pMacPre were differentiated for 14 days to pMac, pMGL, or co-cultured with neurons to obtain co-pMG, which were either stained in single-cell suspension of the co-culture or isolated with CD11b beads before staining. (B) Expression of surface markers (three genetic backgrounds, lines SBAD3-01, SFC840-03-03, SFC856-03-04) in pMacpre, pMac, pMGL, and co-cultures at 2, 7, 10, and 14 days. To remove obviously non-myeloid cells from MFI analysis, we set a gate to FL1, FL2, and FL4 for all cytometry data. Error bars denote SEM. See Figure S7 for FSC/SSC gating and additional cytometry data.
Figure 5
Figure 5
Co-culture with Neurons Promotes iPSC-Microglial Motility Macrophages and co-culture microglia were imaged every 5 min for 5 hr (two videos each of three cultures i.e., six replicates per condition). (A) co-pMG expressing RFP to enable identification in co-culture. Scale bar, 200 μm. (B–D) Tracks of co-culture microglia (co-pMG; B), compared with cells on tissue-culture plastic: pMGL (C) and pMac (D). |(E) Accumulated distance. (F) Euclidian distance (distance in a straight line, start to end). Error bars represent SD. Statistical analysis by Tukey's multiple comparisons test. p < 0.05, ∗∗∗p < 0.001, ∗∗∗∗p < 0.0001; n.s., not significant. See also Movies S2, S3, andS4.
Figure 6
Figure 6
LPS Induces Inflammatory Morphology and Clustering in Co-culture Microglia (A–D) Microglial morphology displayed as inverted LUT black and white images of RFP-iPSC microglia in co-culture. (A) Images (co-culture day 12) every 5 min for 10 hr. Representative images of LPS-stimulated co-pMG are shown at 0, 5, and 10 hr. (B) co-pMG clustering on LPS stimulation shown by cell tracking. (C–E) Quantitative analysis (two videos each of three cultures, i.e., six replicates per condition). Images were taken on co-culture on day 14 every 5 min for 20 hr. (C) Representative images of 0-hr and 20-hr time points; Bottom panel: area in the black square magnified to show microglial morphology: unstimulated co-pMG show no obvious changes in morphology during imaging period, but on LPS stimulation some microglia cluster, adopting more ameboid morphology with shorter processes and higher area-to-perimeter ratio, representative of a pro-inflammatory phenotype (black arrows). (D) Distance between microglia clustering upon stimulation is evidenced by a leftward shift of the plot after 10 hr and 20 hr. (E) Micrographs were scored blind by three independent assessors for number of microglia with activated morphology. Statistical analysis by Dunnett's multiple comparison test. n.s., not significant; p < 0.05. Scale bars, 200 μm. See also Movie S5.
Figure 7
Figure 7
Cytokine Profiles of Co-culture versus Monocultures Eighteen-hour supernatants from cells stimulated with or without LPS/IFNγ were assayed with a Luminex multiplex assay. DMEM/F12/N2-based microglia medium was used for monoculture (pMGL), co-culture (co-pMG), and neuron-only culture (pNeuron); standard XVIVO15-based macrophage medium was used for pMac. Medium alone contained negligible levels of all cytokines tested. Supernatants from lines: SBAD3-01 neurons ± SFC180-01-01, SFC840-03-03, and SFC856-03-04 macrophages/microglia. (A) Unstimulated cells. (B) LPS/IFNγ-stimulated cells. Mean ± SD, three genetic backgrounds. Asterisks indicate significant difference between co-pMG and pMGL by two-tailed paired t test. p < 0.05, ∗∗p < 0.01, ∗∗∗p < 0.001, ∗∗∗∗p < 0.0001. See Table S2 for further factors tested with pMac and co-pMG, and Figure S6 for effect of additional media and growth factor combinations on cytokine secretion.

References

    1. Abud E., Ramirez R., Martinez E., Healy L., Nguyen C., Newman S., Yeromin A., Scarfone V., Marsh S., Fimbres C. iPSC-derived human microglia-like cells to study neurological diseases. Neuron. 2017;94:278–293.e9. - PMC - PubMed
    1. Aflaki E., Stubblefield B., Maniwang E., Lopez G., Moaven N., Goldin E., Marugan J., Patnaik S., Dutra A., Southall N. Macrophage models of Gaucher disease for evaluating disease pathogenesis and candidate drugs. Sci. Transl. Med. 2014;6:240ra73. - PMC - PubMed
    1. Alasoo K., Martinez F.O., Hale C., Gordon S., Powrie F., Dougan G., Mukhopadhyay S., Gaffney D.J. Transcriptional profiling of macrophages derived from monocytes and iPS cells identifies a conserved response to LPS and novel alternative transcription. Sci. Rep. 2015;5:12524. - PMC - PubMed
    1. Almeida S., Zhang Z., Coppola G., Mao W., Futai K., Karydas A., Geschwind M.D., Tartaglia M.C., Gao F., Gianni D. Induced pluripotent stem cell models of progranulin-deficient frontotemporal dementia uncover specific reversible neuronal defects. Cell Rep. 2012;2:789–798. - PMC - PubMed
    1. Bain C.C., Bravo-Blas A., Scott C.L., Gomez Perdiguero E., Geissmann F., Henri S., Malissen B., Osborne L.C., Artis D., Mowat A.M. Constant replenishment from circulating monocytes maintains the macrophage pool in the intestine of adult mice. Nat. Immunol. 2014;15:929–937. - PMC - PubMed

Publication types

MeSH terms