. 2017 Jul 4;8(27):44639-44653.
doi: 10.18632/oncotarget.17961.

Riluzole exerts distinct antitumor effects from a metabotropic glutamate receptor 1-specific inhibitor on breast cancer cells

Affiliations

Riluzole exerts distinct antitumor effects from a metabotropic glutamate receptor 1-specific inhibitor on breast cancer cells

Sonia C Dolfi et al. Oncotarget. .

Abstract

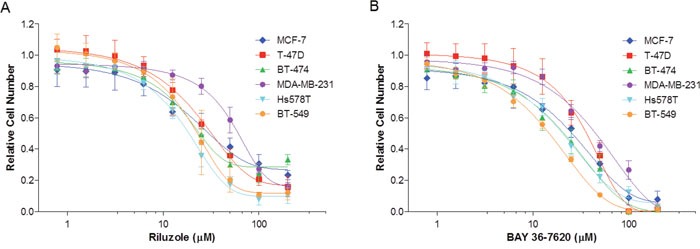
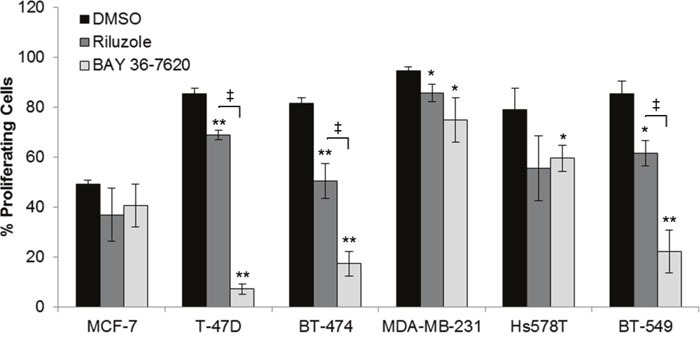
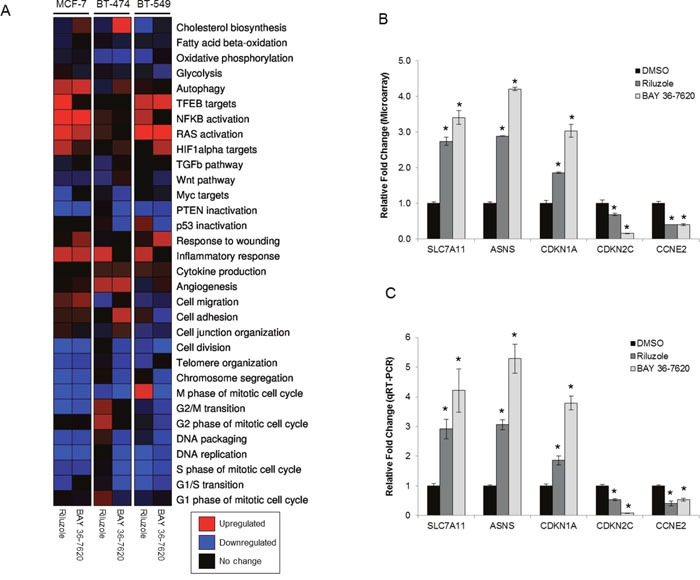
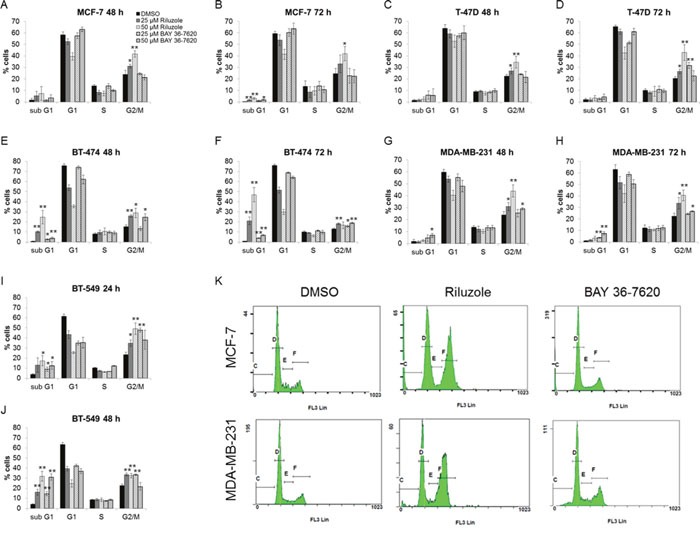
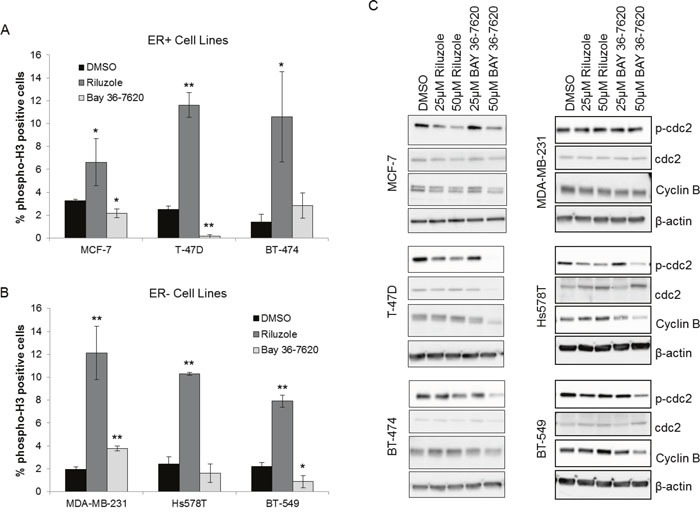
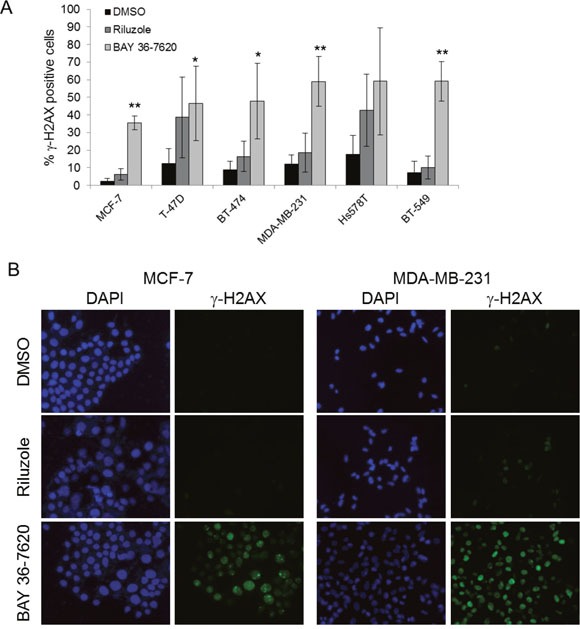
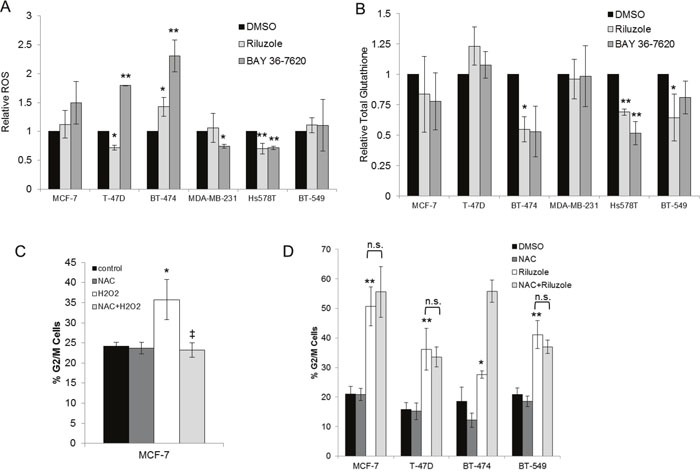
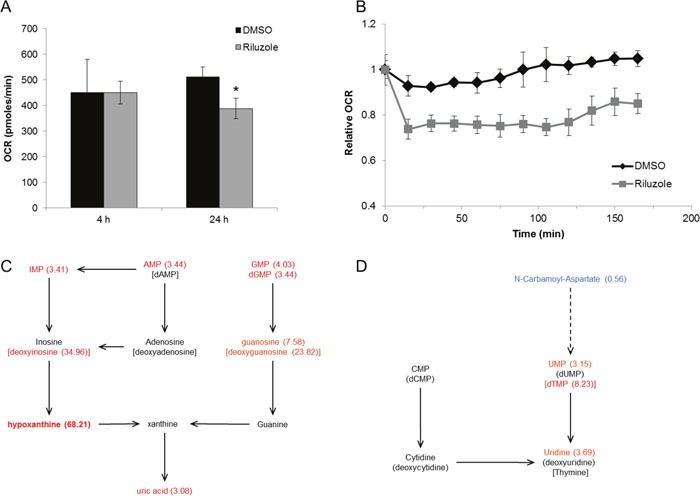
Recent evidence suggests that glutamate signaling plays an important role in cancer. Riluzole is a glutamate release inhibitor and FDA-approved drug for the treatment of amyotrophic lateral sclerosis. It has been investigated as an inhibitor of cancer cell growth and tumorigenesis with the intention of repurposing it for the treatment of cancer. Riluzole is thought to act by indirectly inhibiting glutamate signaling. However, the specific effects of riluzole in breast cancer cells are not well understood. In this study, the anti-cancer effects of riluzole were explored in a panel of breast cancer cell lines in comparison to the metabotropic glutamate receptor 1-specific inhibitor BAY 36-7620. While both drugs inhibited breast cancer cell proliferation, there were distinct functional effects suggesting that riluzole action may be metabotropic glutamate receptor 1-independent. Riluzole induced mitotic arrest independent of oxidative stress while BAY 36-7620 had no measurable effect on mitosis. BAY 36-7620 had a more pronounced and significant effect on DNA damage than riluzole. Riluzole altered cellular metabolism as demonstrated by changes in oxidative phosphorylation and cellular metabolite levels. These results provide a better understanding of the functional action of riluzole in the treatment of breast cancer.

Keywords: BAY 36-7620; breast cancer; cell cycle; glutamate signaling; riluzole.


Conflict of interest statement

CONFLICTS OF INTEREST

The authors declare no conflicts of interest.

Figures

Figure 1
Figure 1. A panel of breast cancer cell lines expresses GRM1
Estrogen receptor (ER) positive (MCF-7, T-47D, BT-474) and ER negative (MDA-MB-231, Hs578T, BT-549) breast cancer cell lines were tested for GRM1 expression by Western blot. C8161 (GRM1+) and UACC930 (GRM1 C-terminal truncation) melanoma cells were included as a positive and negative control, respectively, for GRM1 expression at the predicted molecular weight (MW) of 132 kilodaltons (kDa). β-actin served as a loading control.
Figure 2
Figure 2. Riluzole and BAY 36-7620 inhibit growth of both hormone receptor positive (MCF-7, T-47D, BT-474) and negative (MDA-MB-231, Hs578T, BT-549) breast cancer cell lines
Cells were treated with riluzole (A) or BAY 36-7620 (B) for 72 h. Relative cell number was measured by MTS assay and normalized relative to vehicle control (DMSO). Data are represented as mean +/− SD.
Figure 3
Figure 3. Riluzole and BAY 36-7620 inhibit cell proliferation in both ER+ and ER- breast cancer cell lines
Cells were treated with 50 μM riluzole or 50 μM BAY 36-7620 for 72 h. 5-ethynyl-2´-deoxyuridine (EdU) incorporation as a measure of proliferating cells was detected by flow cytometry. Data are represented as mean +/− SD. *P < 0.05 compared to DMSO control. **P < 0.005 compared to DMSO control. ‡ P < 0.05 for riluzole compared to BAY 36-7620 treatment (right bracket arm) using one-way ANOVA with Bonferroni's multiple comparison test.
Figure 4
Figure 4. Gene expression signatures are altered by treatment with riluzole or BAY 36-7620
(A) RNA from MCF-7 (48 h treatment), BT-474 (24 h treatment), and BT-549 (24 h treatment) cells treated with either 50 μM riluzole or BAY 36-7620 was applied to a gene expression microarray. Three biological replicates were used for each condition. Heat map representation of gene expression signatures from the average of three biological replicates: significantly upregulated (P< 0.05; red), significantly downregulated (P< 0.05; blue), or no significant change (black) compared to expression in cells treated with DMSO control. (B) Graphical representation of a selection of genes altered by riluzole or BAY 36-7620 in the gene expression microarray for BT-549 cells compared to DMSO control. (C) A two-step RT-PCR was performed on RNA from BT-549 cells for genes up- (SLC7A11, ASNS, CDKN1A) or down-regulated (CDKN2C, CCNE2) by gene expression microarray. Gene expression is shown as relative fold change compared to DMSO control. Data are represented as mean +/− SD. *P < 0.005 compared to DMSO control.
Figure 5
Figure 5. Riluzole induces G2/M cell cycle arrest to a greater extent than BAY 36-7620
MCF-7 (A, B), T-47D (C, D), BT-474 (E, F), MDA-MB-231 (G, H), and BT-549 (I, J) cells were treated with either 25 or 50 μM riluzole or BAY 36-7620 for 24, 48, or 72 h. DNA content was measured by flow cytometry. Data are represented as mean +/− SD. *P < 0.05 compared to DMSO control. **P < 0.005 compared to DMSO control. Representative histograms are shown for 50 μM drug treatment after 72 h for MCF-7 and MDA-MB-231 cell lines (K).
Figure 6
Figure 6. Riluzole induces mitotic arrest in breast cancer cells
ER+ (A) and ER- (B) breast cancer cells were treated with 50 μM riluzole or 50 μM BAY 36-7620 for 48 h. Cells were stained with an antibody specific to phospho-histone H3 at Ser10 (phospho-H3) as a marker for mitosis and detected by flow cytometry. DMSO was used as a vehicle control. *P < 0.05 compared to DMSO control. **P < 0.005 compared to DMSO control. Data are represented as mean +/− SD. (C) Phospho-cdc2 (Tyr 15; p-cdc2) and cyclin B1 expression were measured by Western blot after 24 h (Hs578T, BT-549) or 48 h (MCF-7, T-47D, BT-474, MDA-MB-231) drug treatment. Representative blot is shown (Western blot densitometry shown in Supplementary Figure 2). β-actin and cdc-2 served as loading controls for cyclin B1 and p-cdc2 respectively.
Figure 7
Figure 7. Riluzole and BAY 36-7620 induce DNA damage
(A) Immunofluorescence for γ-H2AX was performed on cell lines treated with 50 μM riluzole or 50 μM BAY 36-7620 for 24 h. Positive γ-H2AX staining is shown as a percentage of total cells. DAPI was used as a nuclear stain. Data are represented as mean +/− SD. *P < 0.05 compared to DMSO control. **P < 0.005 compared to DMSO control. (B) Representative images of MCF-7 and MDA-MB-231 cells with γ-H2AX foci by immunofluorescence.
Figure 8
Figure 8. Riluzole-mediated G2/M arrest is independent of induction of oxidative stress
Breast cancer cell lines treated with 50 μM riluzole or 50 μM BAY 36-7620 for 24 h were evaluated for levels of reactive oxygen species (ROS) (A) and total intracellular glutathione (GSH) (B). Relative fold change was compared to DMSO control. *P < 0.05 compared to DMSO control. **P < 0.005 compared to DMSO control. Cell cycle distribution (represented as the percentage of cells in G2/M) was detected by flow cytometry in cells pretreated with 5mM N-acetyl-cysteine (NAC) followed by the addition of 25 μM H2O2 (C) or 50 μM riluzole (D). *P < 0.05 compared to control. **P < 0.005 compared to control. ‡ P < 0.005 for NAC+H2O2 compared to H2O2 treatment alone. Not significant (n.s.). Data are represented as mean +/− SD.
Figure 9
Figure 9. Riluzole inhibits oxidative phosphorylation and alters cellular metabolism
(A) BT-474 cells were treated with control (DMSO) or 50 μM riluzole for 4 h or 24 h. Oxygen consumption rates (OCR) were measured on the XF analyzer and are shown relative to basal levels. *P < 0.05 compared to DMSO control. (B) Basal OCR was measured in BT-474 cells at time 0 followed by treatment with DMSO or 50 μM riluzole. OCR was measured at 15 min intervals after treatment. Data are represented as mean +/− SD. (C, D) Cellular metabolite analysis by LC/MS was performed on BT-474 cells treated with 50 μM riluzole for 24 h and normalized to DMSO control (see Supplementary Table 3 for complete list of relative fold changes). Components of purine (C) and pyrimidine (D) metabolism altered by riluzole are shown (fold change in parenthesis).

Similar articles

Cited by

References

    1. Mehta MS, Dolfi SC, Bronfenbrener R, Bilal E, Chen C, Moore D, Lin Y, Rahim H, Aisner S, Kersellius RD, Teh J, Chen S, Toppmeyer DL, et al. Metabotropic glutamate receptor 1 expression and its polymorphic variants associate with breast cancer phenotypes. PLoS One. 2013;8:e69851. - PMC - PubMed
    1. Teh JL, Chen S. Glutamatergic signaling in cellular transformation. Pigment Cell Melanoma Res. 2012;25:331–342. - PubMed
    1. Willard SS, Koochekpour S. Glutamate signaling in benign and malignant disorders: current status, future perspectives, and therapeutic implications. Int J Biol Sci. 2013;9:728–742. - PMC - PubMed
    1. Speyer CL, Smith JS, Banda M, DeVries JA, Mekani T, Gorski DH. Metabotropic glutamate receptor-1: a potential therapeutic target for the treatment of breast cancer. Breast Cancer Res Treat. 2012;132:565–573. - PMC - PubMed
    1. Speyer CL, Hachem AH, Assi AA, Johnson JS, DeVries JA, Gorski DH. Metabotropic glutamate receptor-1 as a novel target for the antiangiogenic treatment of breast cancer. PLoS One. 2014;9:e88830. - PMC - PubMed

MeSH terms

Substances

LinkOut - more resources