

Associations of Glycemic Control With Cardiovascular Outcomes Among US Hemodialysis Patients With Diabetes Mellitus
- PMID: 28592463
- PMCID: PMC5669174
- DOI: 10.1161/JAHA.117.005581
Associations of Glycemic Control With Cardiovascular Outcomes Among US Hemodialysis Patients With Diabetes Mellitus
Abstract
Background: There is a lack of data on the relationship between glycemic control and cardiovascular end points in hemodialysis patients with diabetes mellitus.
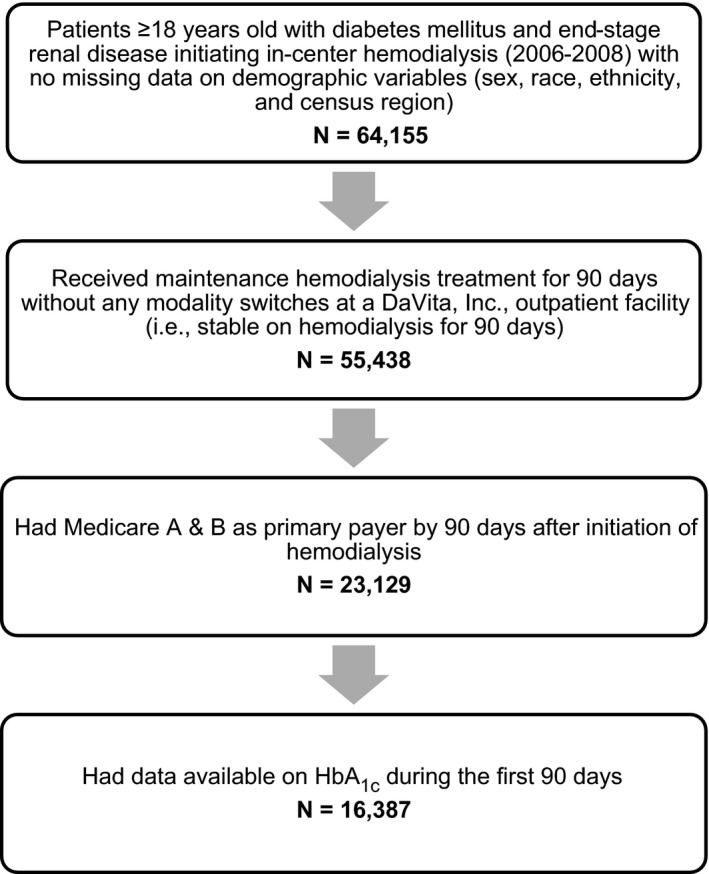
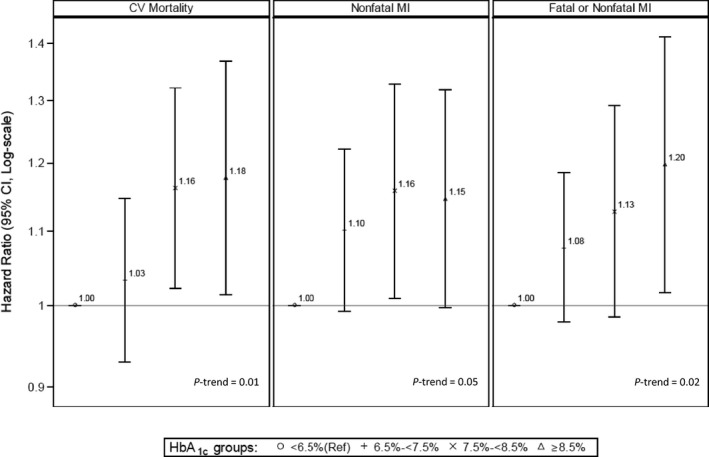
Methods and results: We included adult Medicare-insured patients with diabetes mellitus who initiated in-center hemodialysis treatment from 2006 to 2008 and survived for >90 days. Quarterly mean time-averaged glycated hemoglobin (HbA1c) values were categorized into <48 mmol/mol (<6.5%) (reference), 48 to <58 mmol/mol (6.5% to <7.5%), 58 to <69 mmol/mol (7.5% to <8.5%), and ≥69 mmol/mol (≥8.5%). Medicare claims were used to identify outcomes of cardiovascular mortality, nonfatal myocardial infarction (MI), fatal or nonfatal MI, stroke, and peripheral arterial disease. We used Cox models as a function of time-varying exposure to estimate multivariable adjusted hazard ratios and 95%CI for the associations between HbA1c and time to study outcomes in a cohort of 16 387 eligible patients. Patients with HbA1c 58 to <69 mmol/mol (7.5% to <8.5%) and ≥69 mmol/mol (≥8.5%) had 16% (CI, 2%, 32%) and 18% (CI, 1%, 37%) higher rates of cardiovascular mortality (P-trend=0.01) and 16% (CI, 1%, 33%) and 15% (CI, 1%, 32%) higher rates of nonfatal MI (P-trend=0.05), respectively, compared with those in the reference group. Patients with HbA1c ≥69 mmol/mol (≥8.5%) had a 20% (CI, 2%, 41%) higher rate of fatal or nonfatal MI (P-trend=0.02), compared with those in the reference group. HbA1c was not associated with stroke, peripheral arterial disease, or all-cause mortality.
Conclusions: Higher HbA1c levels were significantly associated with higher rates of cardiovascular mortality and MI but not with stroke, peripheral arterial disease, or all-cause mortality in this large cohort of hemodialysis patients with diabetes mellitus.
Keywords: cardiovascular outcomes; diabetes mellitus; glycemic control; hemodialysis.
© 2017 The Authors. Published on behalf of the American Heart Association, Inc., by Wiley.
Figures
References
-
- National Kidney Foundation . 2013 USRDS annual data report: atlas of chronic kidney disease and end‐stage renal disease in the United States. Am J Kidney Dis. 2014;63(supp):e1–e478.
-
- Gæde P, Vedel P, Larsen N, Jensen GV, Parving HH, Pedersen O. Multifactorial intervention and cardiovascular disease in patients with type 2 diabetes. N Engl J Med. 2003;348:383–393. - PubMed
-
- Kalantar‐Zadeh K, Kopple JD, Regidor DL, Jing J, Shinaberger CS, Aronovitz J, McAllister CJ, Whellan D, Sharma K. A1C and survival in maintenance hemodialysis patients. Diabetes Care. 2007;30:1049–1055. - PubMed
-
- United States Renal Data System: excerpts from the USRDS 2005 annual data report: atlas of end‐stage renal disease in the United States, National Institutes of Health, National Institutes of Diabetes and Digestive and Kidney Diseases. Am J Kidney Dis. 2006;47(suppl 1):1–286.
-
- The Diabetes Control and Complications Trial Research Group .The effect of intensive treatment of diabetes on the development and progression of long‐term complications in insulin‐dependent diabetes mellitus. N Engl J Med. 1993;329:977–986. - PubMed
Publication types
MeSH terms
Substances
Grants and funding
LinkOut - more resources
Full Text Sources
Other Literature Sources
Medical
Miscellaneous
