. 2017 Jun;206(2):665-689.
doi: 10.1534/genetics.117.199950.

A Short History and Description of Drosophila melanogaster Classical Genetics: Chromosome Aberrations, Forward Genetic Screens, and the Nature of Mutations

Affiliations

A Short History and Description of Drosophila melanogaster Classical Genetics: Chromosome Aberrations, Forward Genetic Screens, and the Nature of Mutations

Thomas C Kaufman. Genetics. 2017 Jun.

Abstract

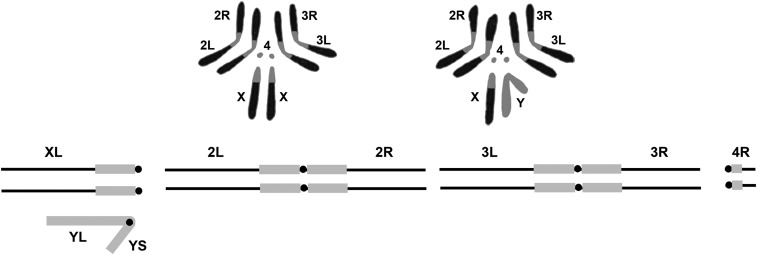
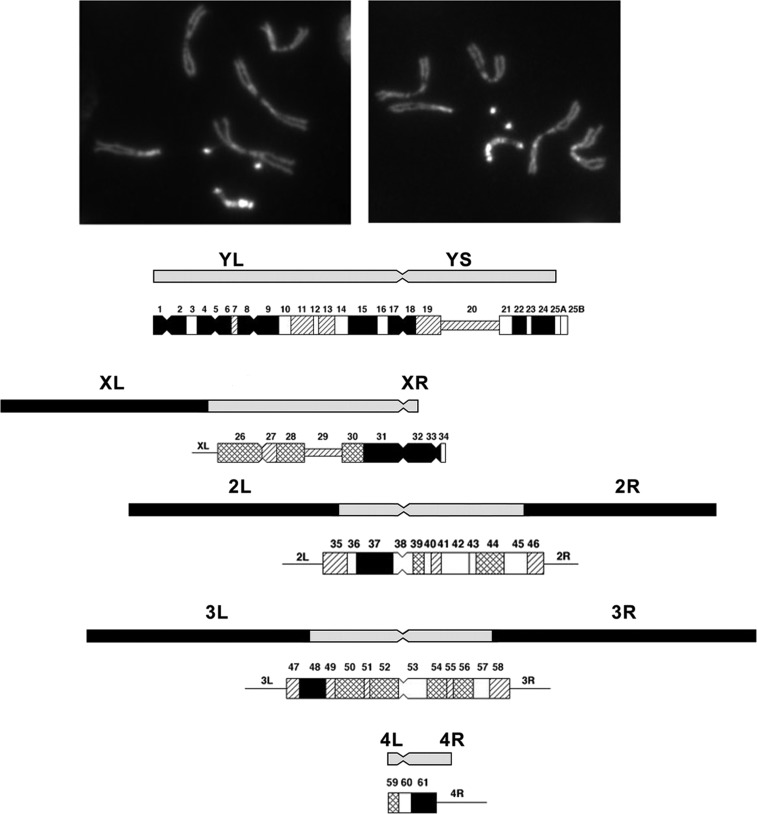
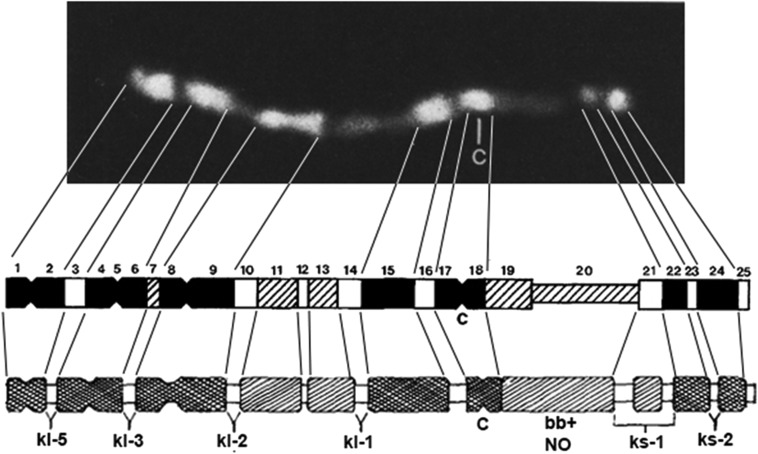
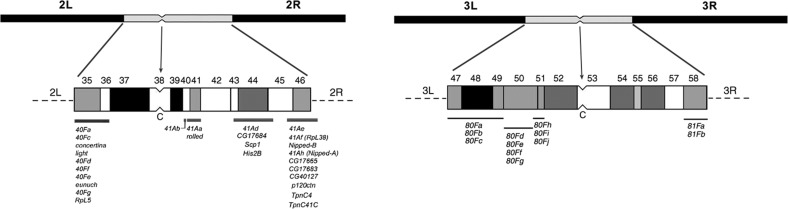
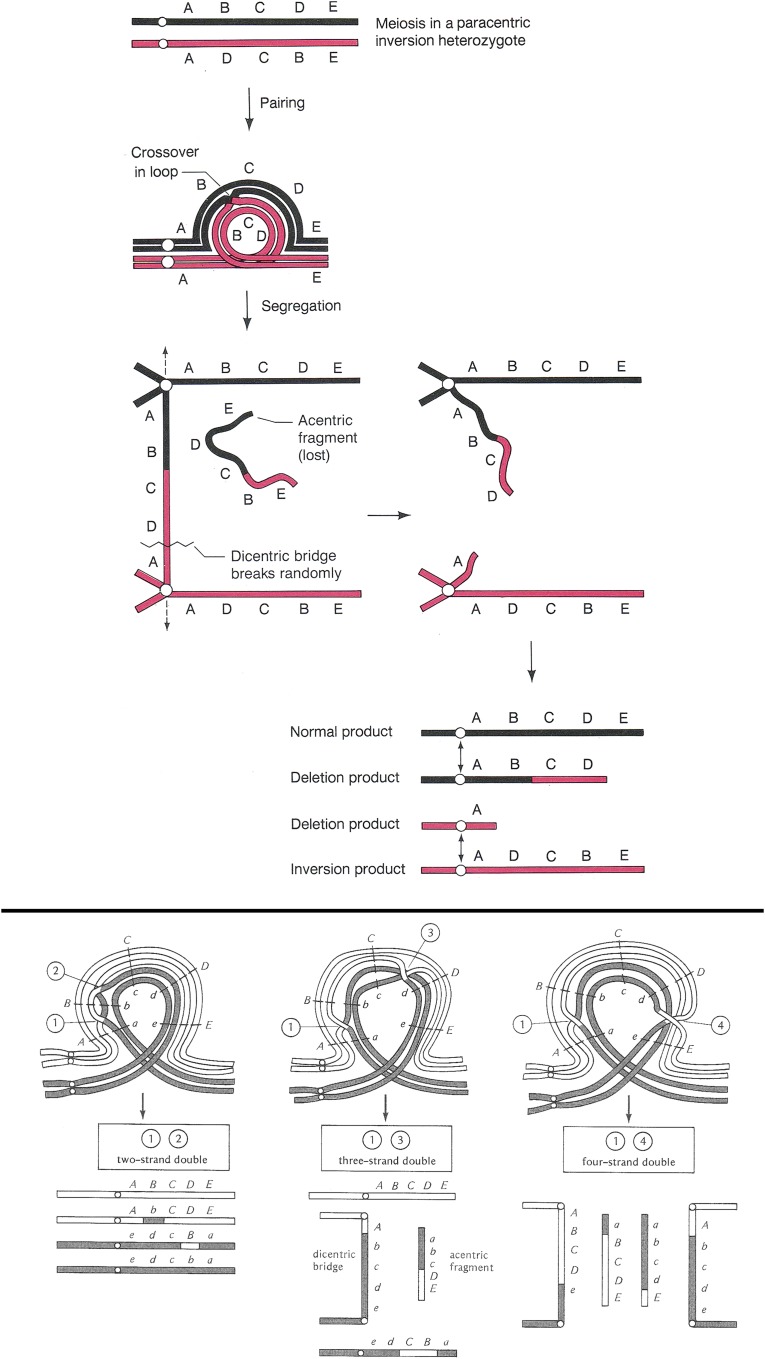
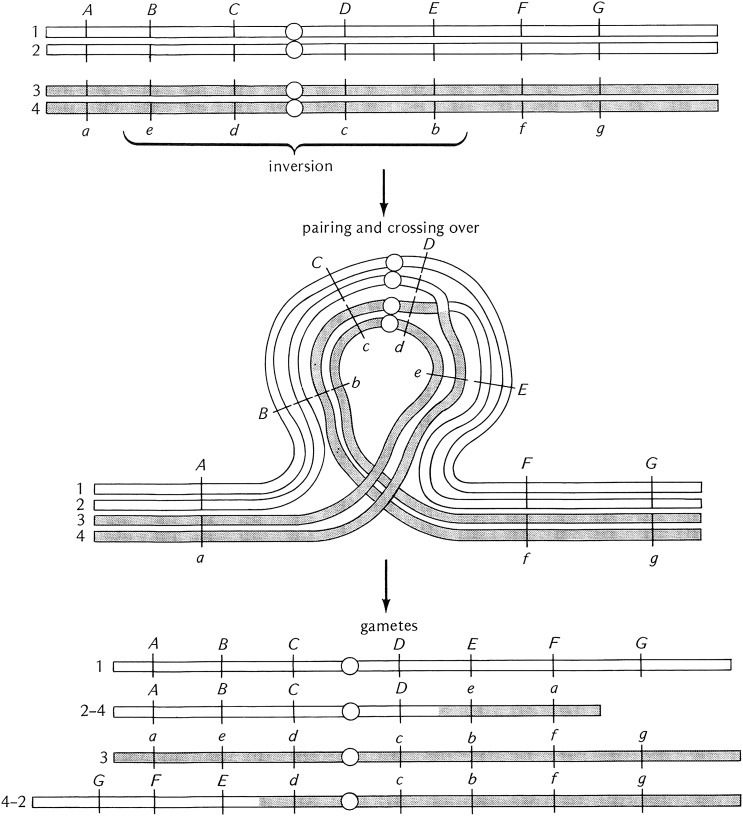
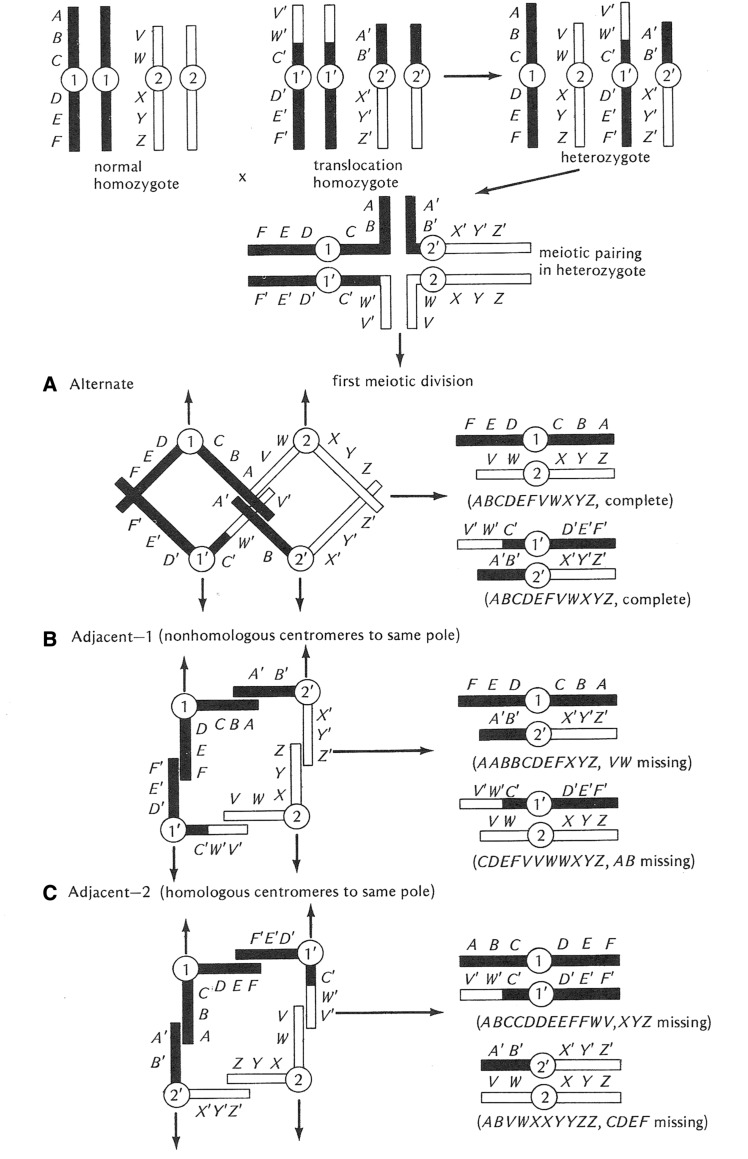
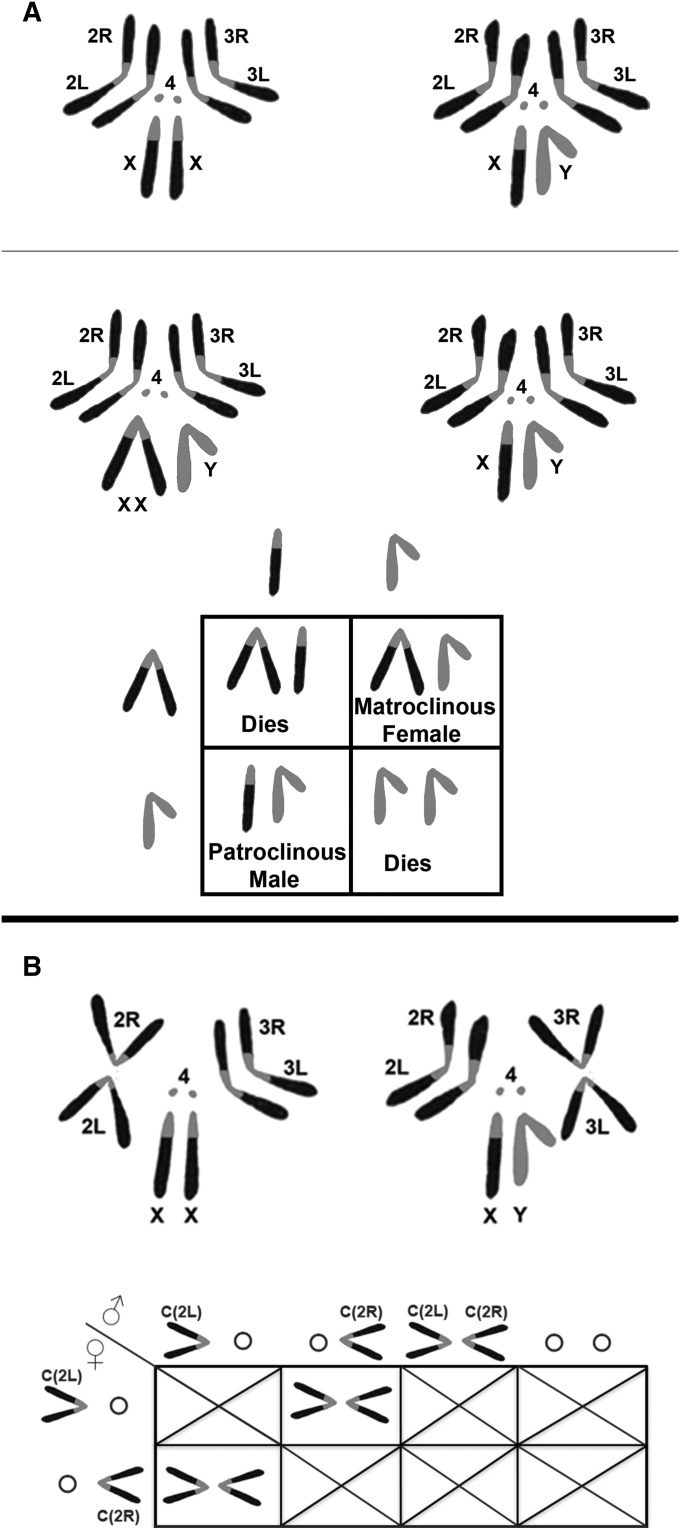
The purpose of this chapter in FlyBook is to acquaint the reader with the Drosophila genome and the ways in which it can be altered by mutation. Much of what follows will be familiar to the experienced Fly Pusher but hopefully will be useful to those just entering the field and are thus unfamiliar with the genome, the history of how it has been and can be altered, and the consequences of those alterations. I will begin with the structure, content, and organization of the genome, followed by the kinds of structural alterations (karyotypic aberrations), how they affect the behavior of chromosomes in meiotic cell division, and how that behavior can be used. Finally, screens for mutations as they have been performed will be discussed. There are several excellent sources of detailed information on Drosophila husbandry and screening that are recommended for those interested in further expanding their familiarity with Drosophila as a research tool and model organism. These are a book by Ralph Greenspan and a review article by John Roote and Andreas Prokop, which should be required reading for any new student entering a fly lab for the first time.

Keywords: FlyBook; balancers; chromosome aberrations; genome; screens.


Figures

Figure 1
Figure 1
The upper portion of the figure shows a representation of the karyotype of D. melanogaster. Chromosomes from female third instar larval neuroblasts on the left and males on the right. Below is a diagrammatic representation of the genome indicating the names of the arms of the sex chromosomes and autosomes. Note that the small XR and 4L arms are not shown. The euchromatic portions of the genome are shown in black and the heterochromatin in gray.
Figure 2
Figure 2
Photomicrographic and diagrammatic representation of the heterochromatic elements of D. melanogaster. The photomicrographs show male larval neuroblasts stained with Hoechst. The brightly fluorescent dots are the fourth chromosome and the longer bright chromosome the Y. The diagram below shows the position of the pericentric heterochromatin of the X, second, and third chromosomes, and the Y and fourth. Below each heterochromatic region, the differentially-staining blocks of these regions of the chromosomes are shown. The position of the centromere is indicated by a constriction. Modified from Gatti and Pimpinelli (1992).
Figure 3
Figure 3
Cytogenetic map of the Y chromosome of D. melanogaster. At the top is a photomicrograph of the banding pattern of a Hoechst-stained Y chromosome. Below are diagrammatic representations of the banding revealed by differential staining of the Y. The darker blocks correspond to more brightly-staining regions. The position of the centromere is indicated by a constriction and the letter c. Genetic mapping has positioned the YL (kl-5, kl-3, kl-2, and kl-1) and YS (ks-1 and ks-2) male fertility factors in the dim regions adjacent to the bright blocks. The bobbed locus or nucleolus organizer region (ribosomal RNA cistrons) is in YS between the bright blocks at the centromere and the distal pair at the telomere of the short arm.
Figure 4
Figure 4
Diagrams of heterochromatic blocks of chromosomes 2 and 3 and the positions of the genes located in the pericentric heterochromatin. The position of the centromere is indicated by a constriction and the letter C. The blocks are numbered as in Figure 2. The position of the genes is shown by bars below the block diagrams and the list of the genes below the bars. The brightly fluorescing blocks are black, less bright in gray and dull regions in white. After Dimitri et al. (2009).
Figure 5
Figure 5
The original polytene chromosome map drawings of Bridges (1935). The band pattern names are shown below the drawings and are described in the text. The lines above the chromosomes show the recombination map positions (numbers below the lines) and the genes with their individual map positions above the lines. Those genes which had been localized cytologically to the chromosomes are joined to the chromosomes by solid and dotted lines connecting the position of the gene on the recombination map to the bands of the polytene chromosomes.
Figure 6
Figure 6
The photographic polytene chromosome maps of Lefevre (1976). These maps are collages of idealized segments of the polytene chromosomes. Below each arm are the positions of the numbered segments using Bridges’ nomenclature. Above each arm are the corresponding drawing taken from Bridges’ original maps. The bands demarking each numbered segment are connected by lines between each of the two map versions.
Figure 7
Figure 7
Genetic saturation map of the zeste – white interval on the X chromosome. The banding pattern of the 3A1,2–3C2,3 is shown at the top. Using zeste in 3A2 and white in 3C2 as left and right positions, this interval contains 14 polytene bands on Bridges’ map. The first line below the map shows the names and order of the lethal loci identified in saturation screens. The next line shows the positions and identity of genes mapped at the molecular level, which are known alleles of the original genetically identified lethals. The lists below are genes known from the molecular annotation of this interval with arrows indicating their positions relative to the genetic map. Note that there are many more molecularly defined loci than have genetically identified lesions. In addition to the loci listed in this figure, there are ∼30 additional mutations provisionally assigned to this interval whose allelic relationship to either the molecularly or genetically identified loci has yet to be determined. After Judd et al. (1972).
Figure 8
Figure 8
Diagrammatic representation of the extent of deletions and duplications molecularly mapped to the fourth chromosome. At the top are photographic and drawing maps of the chromosome with the Bridges’ numerical and lettered subdivisions indicated below the drawing. Lines extending from the map show the corresponding intervals on the molecular map. The blue arrows below the map intervals show the position and direction of transcription of the loci annotated to the sequence of the chromosome. The red bars below the loci indicate the position and extent of the deficiencies. The blue bars beneath the deficiencies indicate the position and extent of the segregating duplications, which have been made by transgenic fragments. After Lefevre (1976) and FlyBase.
Figure 9
Figure 9
Diagrammatic representation of the paring configuration and consequences of crossing over in a female heterozygous for a paracentric inversion. At the top the pairing configuration is shown as a loop. A single crossover within the loop results in the formation of a dicentric bridge and an acentric fragment at the first meiotic division. The bridge can break at random positions and the acentric fragment is lost. The result of this single exchange is the production of two euploid progeny, one inverted and the other normal. The other two meiotic products are grossly aneuploid and are unlikely to support normal development if used. Below the single exchange diagram are shown the results of double exchanges within the paired inversion loop. If a double exchange takes place between the same pair of chromatids (two-strand double), the interval between the two crossovers will be exchanged between the inverted and normal sequence homologs and all euploid products will be formed. If the double exchange occurs between an odd number of chromatids (three-strand double) or all four (four-strand double), like single crossover bridges and fragments are formed, grossly aneuploid meiotic products will be formed. After Griffiths et al. (2000) and Strickberger (1976). The letters aligned with the chromosomes indicate the positions of genes.
Figure 10
Figure 10
Diagrammatic representation of the consequences of crossing over in a female heterozygous for a pericentric inversion. As for the paracentric inversion, paring occurs in a loop but in this case the centromere is within the inverted region. Exchange events in the paired inverted region produce gametes that are grossly aneuploid for large portions of whole chromosome arms. These aneuploid gametes are incapable of producing viable progeny if used in fertilization. Unlike the paracentric inversions there are no anaphase bridges and acentric fragments produced. After Strickberger (1976). The letters and hash marks along the chromosome arms indicate the position of genes.
Figure 11
Figure 11
Diagrammatic representation of the consequences of heterozygosity for a simple reciprocal translocation. Both male and female heterozygotes for a translocation pair in the form of a cross (shown at the top of the figure). The major consequences of translocation heterozygosity are associated with the three potential patterns of segregation of the centromeres of the translocation and normal homologs. The first type, called Alternate (A) disjunction, results in the segregation of the two normal homologs and the two translocation elements to the opposite poles in the first meiotic division. The resultant gametes are euploid or balanced and will produce viable progeny. The other patterns of segregation, Adjacent 1 (B) and Adjacent 2 (C), result in one of the translocation elements and one of the normal chromosomes migrating to the same pole. Both Adjacent patterns result in the production of grossly aneuploid gametes that are incapable of producing viable progeny. The Alternate and Adjacent patterns occur in a 1:1 ratio and result in heterozygotes having 50% fertility relative to either homozygous condition. After Strickberger (1976). The letters along the chromosomes indicate the position of genes.
Figure 12
Figure 12
(A) Diagram of the karyotypes of normal and attached X females and the pattern of inheritance of the attachment. In an attached X female both normally acrocentric X arms are associated with a single centromere. Shown at the top is the normal karyotype, below that is an example of a Compound Reverse Metacentric [C(1)RM]. The Punnett Square shows the gametes produced by a C(1)RM/Y female on the left and a normal X/Y male above the square. Unlike the normal “crisscross” pattern of the sex chromosome pattern of inheritance, the daughters inherit their X chromosomes from their mother (matroclinous inheritance) and the sons inherit their X from their father (patroclinous inheritance). Only the Y chromosomes are exchanged to the opposite sex. Also note that the XXX and YY progeny die. Thus, only 50% of the zygotes from an attached X cross survive. (B) Diagram of karyotypes of compound autosome and the gamete types produced by compound-bearing animals. The normally metacentric autosomes can be fused or translocated at the centromere such that the left and right arms are now attached. At the top left a Compound 2L;2R female [C(2L);C(2R)], and to the right a Compound 3L;3R male [C(3L);C(3R)] are shown. Below, the Punnett Square presents the gametes produced in females and males carrying C(2L);C(2R). Females segregate the two compound arms 100% of the time and thus form two types of ova: C(2L) and C(2R). Males on the other hand form all four potential types of sperm in equal frequency. The only viable progeny are formed when reciprocal meiotic segregation products join: C(2L) + C(2R). All other combinations are grossly aneuploidy and lethal. Note that any cross of a compound-bearing male or female to a normal animal will be essentially sterile. The only exception is if a compound-bearing male C(2L);C(2R) or O;O sperm fertilize a reciprocal nullo-2 or diplo-2 ovum produced by nondisjunction in the mated female.
Figure 13
Figure 13
The mechanism by which paracentric inversions prevent the recovery of crossover chromatids in females. At fertilization, meiosis is completed in the oocyte. The axis of the meiotic spindle forms perpendicular to the surface of the egg. If an exchange has taken place within the inverted sequence, the bridge formed constrains the involved chromatids to the center of the first meiotic anaphase. At the second division, the exchange chromatids are confined to the central nuclei while the nonexchange chromatids are segregated into the nuclei at the two ends of the polarized meiotic spindle. The fragment associated with the bridge is lost in the middle of the polar spindle. The inner-most haploid nucleus, the one furthest from the egg surface, is always the one that is used as the oocyte nucleus and will participate in syngamy. Thus, heterozygosity for a paracentric inversion does not prevent crossing over but rather prevents the recovery of crossover chromatids by constraining them to the central two nuclear products of the polarized meiotic spindle. After Strickberger (1976).
Figure 14
Figure 14
Schematic representation of Muller’s ClB screen for sex-linked lethals and/or visibles. (A) A cross of an X-ray-treated male to a ClB heterozygous female is shown. In the F1 progeny, ClB/X* female progeny are collected and mated to normal male siblings (B). The F2 progeny are scored for the presence of either non-Bar-eyed males or non-Bar-eyed males that have an altered phenotype. The limitation of this technique is that recovery of the chromosome with a newly-induced lethal mutation has to be accomplished from the X*/X+ sibling females, which have no convenient markers and can undergo free recombination between the two X chromosomes. This deficiency was overcome by development of better “balancer” chromosomes that are well-marked, viable, and fertile in males. If one is interested in recovering sex-linked visible or viable behavioral mutations, a generation can be saved by using attached X chromosomes. In this case, mutagenized males are mated to C(1)RM/Y females and the F1 progeny screened for changes (C). Each patroclinous progeny male will be the result of a single treated sperm and thousands of progeny can be easily surveyed.
Figure 15
Figure 15
Schematic diagram showing one potential way to screen for mutations on the autosomes. Males are mutagenized with either irradiation or chemicals (red chromosomes) and mated to females carrying two different autosomal balancer chromosomes that are differentially marked (blue and green chromosomes). Single F1 males carrying a mutagenized red chromosome heterozygous with either balancer (blue or green) are mated to females similar to the P1 parent. In the F2 progeny, males and females carry one of the balancers (red and either green or blue) and a clone of the mutagenized red chromosome. The F3 progeny of this cross can be scored for a variety of mutant types. If the homozygous red animals are absent a lethal has been induced; if they are phenotypically changed a visible. In the case of lethality, the chromosome can be recovered in the heterozygous red over green or blue sibling progeny. This crossing scheme can be modified in a variety of ways and extended to recover steriles, maternal-effect, and grand childless mutations.
Figure 16
Figure 16
Polytene X (A), second (B and C), and third (D and E) chromosome maps after Bridges and Lefevre showing the relative map positions of markers useful for recombination mapping. Stocks containing different combinations of these markers are available at the Bloomington Drosophila Stock Center (http://flystocks.bio.indiana.edu/Browse/misc-browse/mapping.php and http://flystocks.bio.indiana.edu/Browse/misc-browse/Baylor-kits.php). The tables above the chromosomes list the gene symbols (top row), numbered and letter cytological location (middle row), and approximate recombination map position in centi-Morgans of each marker. The lines connecting the tables to the chromosome arms indicate the approximate cytological position of the markers. The markers include lesions that are associated with visible phenotypic changes as well as transgenic insertions carrying the w+ gene.

References

    1. Adams M. D., Celniker S. E., Holt R. A., Evans C. A., Gocayne J. D., et al. , 2000. The genome sequence of Drosophila melanogaster. Science 287: 2185–2195. - PubMed
    1. Ashburner M., Golic K. G., Hawley R. S., 2005. Drosophila: A Laboratory Handbook, Ed. 2 Cold Spring Harbor Laboratory Press, Cold Spring Harbor, NY. pp. 1408.
    1. Auerbach C., Robson J. M., 1946. Chemical production of mutations. Nature 157: 302. - PubMed
    1. Auerbach C., Robson J. M., Carr J. G., 1947. The chemical production of mutations. Science 105: 243–247. - PubMed
    1. Bassett A., Liu J. L., 2014. CRISPR/Cas9 mediated genome engineering in Drosophila. Methods 69: 128–136. - PubMed

Publication types

LinkOut - more resources