. 2017 Jul 27;91(16):e00739-17.
doi: 10.1128/JVI.00739-17. Print 2017 Aug 15.

Gender Parity Trends for Invited Speakers at Four Prominent Virology Conference Series

Affiliations

Gender Parity Trends for Invited Speakers at Four Prominent Virology Conference Series

Robert F Kalejta et al. J Virol. .

Abstract

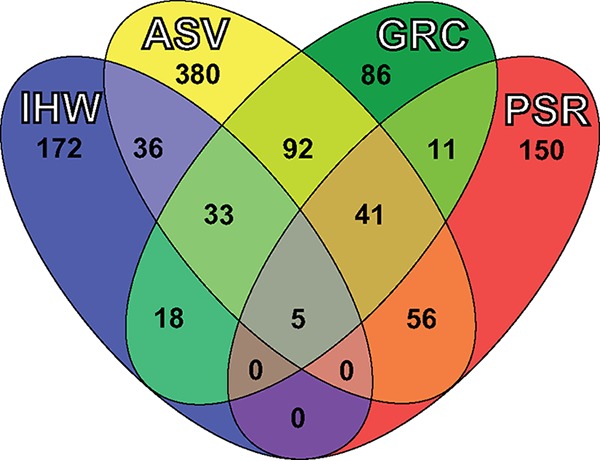
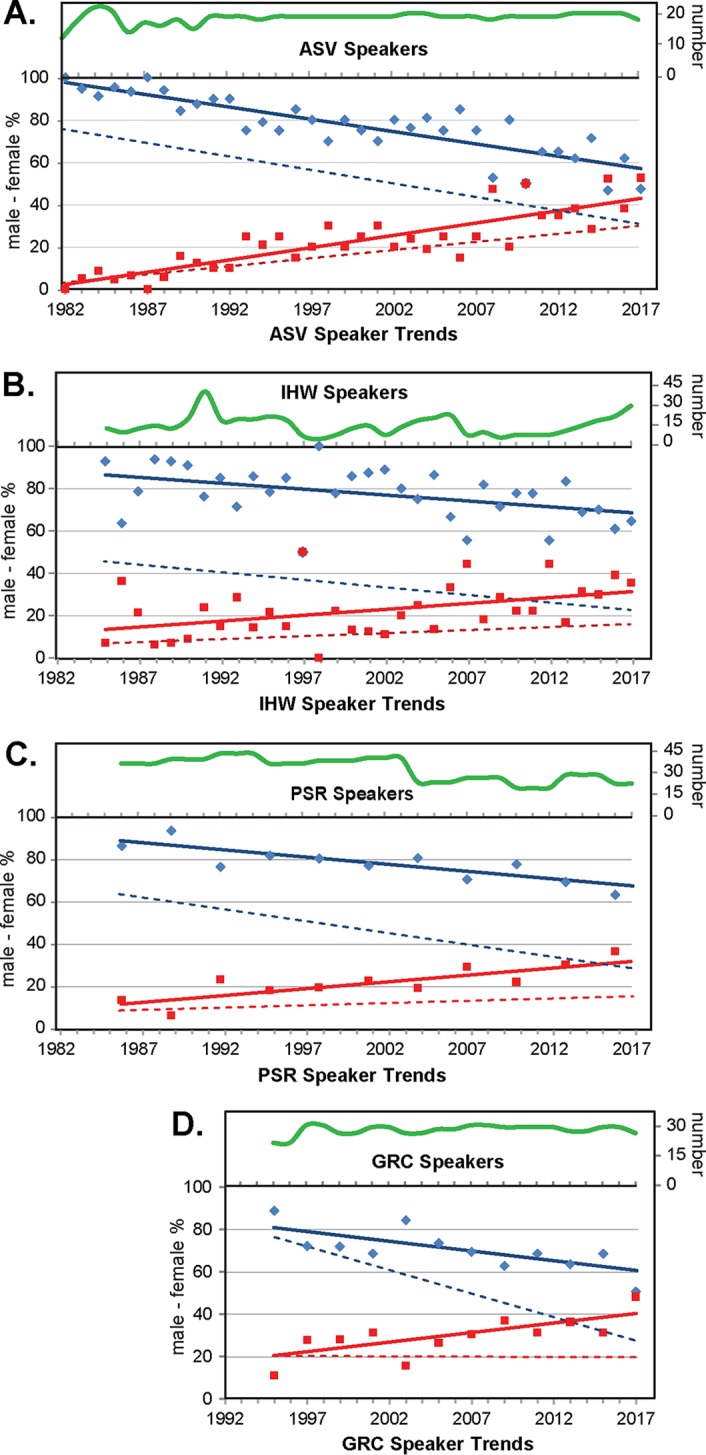
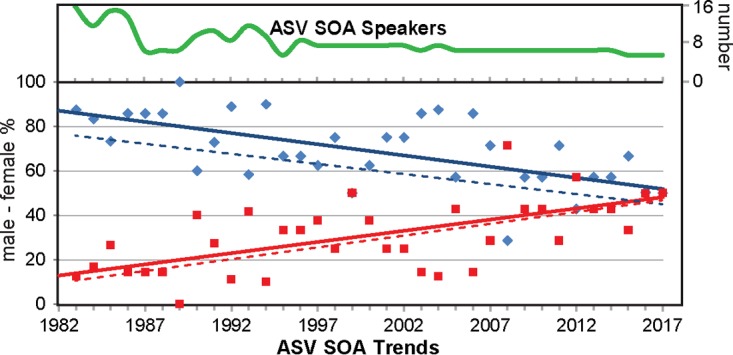
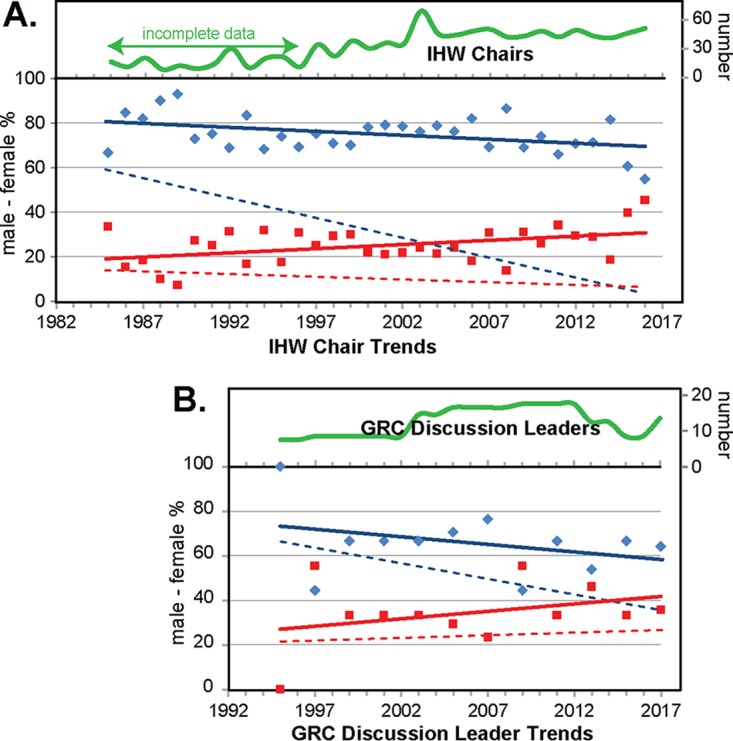
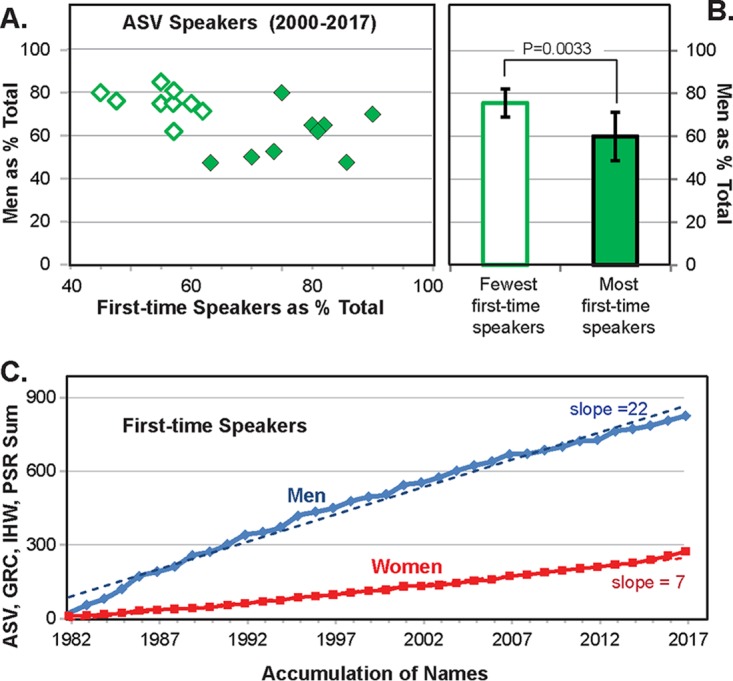
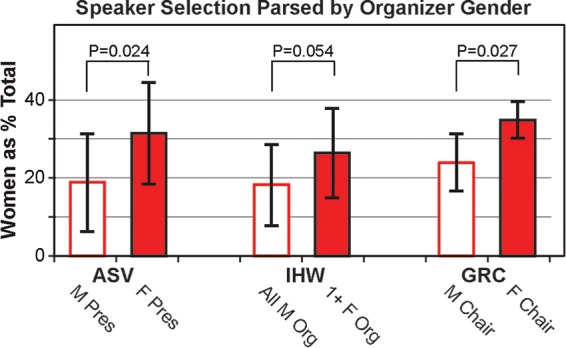
Scientific conferences are most beneficial to participants when they showcase significant new experimental developments, accurately summarize the current state of the field, and provide strong opportunities for collaborative networking. A top-notch slate of invited speakers, assembled by conference organizers or committees, is key to achieving these goals. The perceived underrepresentation of female speakers at prominent scientific meetings is currently a popular topic for discussion, but one that often lacks supportive data. We compiled the full rosters of invited speakers over the last 35 years for four prominent international virology conferences, the American Society for Virology Annual Meeting (ASV), the International Herpesvirus Workshop (IHW), the Positive-Strand RNA Virus Symposium (PSR), and the Gordon Research Conference on Viruses & Cells (GRC). The rosters were cross-indexed by unique names, gender, year, and repeat invitations. When plotted as gender-dependent trends over time, all four conferences showed a clear proclivity for male-dominated invited speaker lists. Encouragingly, shifts toward parity are emerging within all units, but at different rates. Not surprisingly, both selection of a larger percentage of first-time participants and the presence of a woman on the speaker selection committee correlated with improved parity. Session chair information was also collected for the IHW and GRC. These visible positions also displayed a strong male dominance over time that is eroding slowly. We offer our personal interpretation of these data to aid future organizers achieve improved equity among the limited number of available positions for session moderators and invited speakers.IMPORTANCE Politicians and media members have a tendency to cite anecdotes as conclusions without any supporting data. This happens so frequently now, that a name for it has emerged: fake news. Good science proceeds otherwise. The underrepresentation of women as invited speakers at international scientific conferences exemplifies a present-day discussion topic usually occurring without facts to support or refute the arguments. We now provide records profiling four prominent virology conferences over the years 1982 to 2017 with the intention that the trends and accompanying analyses of the gender parity of invited speakers may allow the ongoing discussions to be informed.

Keywords: conference programs; gender; implicit bias; scientific visibility; speaker lists.


Figures

FIG 1
FIG 1
Inclusivity and exclusivity of the ASV, IHW, PSR, and GRC invited speaker programs. The nonredundant “major” speaker names for each conference were counted and are displayed with overlaps in a Venn diagram.
FIG 2
FIG 2
Time-dependent, gender-specific trends of the ASV, IHW, PSR, and GRC major invited speakers. “Major” speaker names were assembled, identified by gender, and plotted for the ASV (A), IHW (B), PSR (C), and GRC (D) series as described in Materials and Methods. The upper (green) lines track the absolute number of speakers per year. Male (blue diamonds) and female (red squares) contributors to each program are shown as the percentage of total speakers for that year. Solid blue (male) and red (female) lines plot the linear regressions of these values. Parallel plots on the same scale (not shown) similarly recorded first-time male and female speakers. Linear regressions of these values (male, dashed blue lines; female, dashed red lines) are plotted.
FIG 3
FIG 3
ASV SOA time-dependent, gender-specific invited speaker trends. SOA speaker names were assembled, identified by gender, and plotted. The upper (green) lines track the absolute number of speakers per year. Male (blue diamonds) and female (red squares) contributors to each program are shown as the percentage of total speakers for that year. Solid blue (male) and red (female) lines plot the linear regressions of these values. Parallel plots on the same scale (not shown) similarly recorded first-time male and female speakers. Linear regressions of these values (male, dashed blue lines; female, dashed red lines) are plotted.
FIG 4
FIG 4
IHW and GRC time-dependent, gender-specific session chair trends. Session chair names for the IHW (A) or discussion leader names for the GRC (B) were assembled, identified by gender, and plotted. The upper (green) lines track the absolute number of chairs/leaders per year. Male (blue diamonds) and female (red squares) contributors to each program are shown as the percentage of total chairs/leaders for that year. Solid blue (male) and red (female) lines plot the linear regressions of these values. Parallel plots on the same scale (not shown) similarly recorded first-time male and female chairs/leaders. Linear regressions of these values (male, dashed blue lines; female, dashed red lines) are plotted. For the IHW from 1985 to 1996, only program sessions listed as “symposia” are included. Additional “workshop” chair information was unavailable (labeled as “incomplete data” on the graph).
FIG 5
FIG 5
ASV conferences with more first-time speakers show better gender parity. (A) The percentage of male ASV symposia and keynote speakers for each year from 2000 to 2017 is plotted as a function of the percent first-time speakers (male and female combined). Individual points on the scatter plot are differentiated as belonging to the years with the highest (filled symbols) or lowest (open symbols) percentages of first-time speakers. (B) For the highest and lowest first-time speaker cohorts, the average percentage of male speakers is plotted. The error is ±1 standard deviation. An unpaired Student t test measured the statistical significance of the difference. (C) The cumulative summation of new individuals (male, blue; female; red) appearing in ASV, SOA, IHW, PSR, or GRC major speaker rosters is plotted as a function of the year (solid lines). Linear regressions of these values (male, dashed blue lines; female, dashed red lines) are plotted and were used to calculate the slopes. R2 = 0.985 (male) and 0.989 (female).
FIG 6
FIG 6
Female participation in speaker selection correlates with improved gender parity. The indicated conference series were each divided into years in which the individuals or committees that chose the invited speakers were exclusively male (open bars) or had female representation (filled bars). The average female speaker representation (% of total) for each subgroup is plotted. The error is ±1 standard deviation. An unpaired Student t test measured the statistical significance of the difference.

Comment in

  • The world is yours.
    Österblom H. Österblom H. Lancet. 2019 Feb 9;393(10171):528-529. doi: 10.1016/S0140-6736(18)32107-X. Lancet. 2019. PMID: 30739685 No abstract available.

References

    1. Schroeder J, Dugdale HL, Radersma R, Hinsch M, Buehler DM, Saul J, Porter L, Liker A, De Cauwer I, Johnson PJ, Santure AW, Griffin AS, Bolund E, Ross L, Webb TJ, Feulner PGD, Winney I, Szulkin M, Komdeur J, Versteegh MA, Hemelrijk CK, Sevensson EI, Edwards H, Karlsson M, West SA, Barrett ELB, Richardson DS, Van Den Brink V, Wimpenny JH, Ellwood SA, Rees M, Matson KD, Charmantier A, Dos Remedios N, Schneider NA, Teplitsky C, Laurance WF, Butlin RK, Horrocks NPC. 2013. Fewer invited talks by women in evolutionary biology symposia. J Evol Biol 26:2063–2069. doi: 10.1111/jeb.12198. - DOI - PMC - PubMed
    1. Casadevall A. 2015. Achieving speaker gender equity at the American Society of Microbiology general meeting. mBio 6:e01146-15. doi: 10.1128/mBio.01146-15. - DOI - PMC - PubMed
    1. Martin JL. 2014. Ten simple rules to achieve conference speaker balance. PLoS Comput Biol 10:e1003903. doi: 10.1371/journal.pcbi.1003903. - DOI - PMC - PubMed
    1. Joklik WK, Grossberg SE. 2006. How the American Society for Virology was founded. Virology 344:250–257. doi: 10.1016/j.virol.2005.09.022. - DOI - PubMed
    1. Casadevall A, Handelsman J. 2014. The presence of female conveners correlates with a higher proportion of female speakers at scientific symposia. mBio 5:e00846-13. doi: 10.1128/mBio.00846-13. - DOI - PMC - PubMed

LinkOut - more resources