

Functional neuroimaging of high-risk 6-month-old infants predicts a diagnosis of autism at 24 months of age
- PMID: 28592562
- PMCID: PMC5819345
- DOI: 10.1126/scitranslmed.aag2882
Functional neuroimaging of high-risk 6-month-old infants predicts a diagnosis of autism at 24 months of age
Abstract
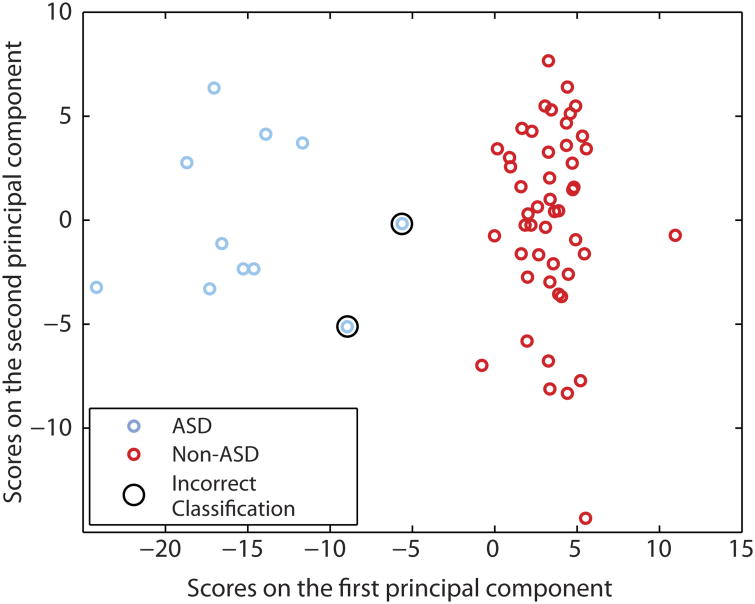
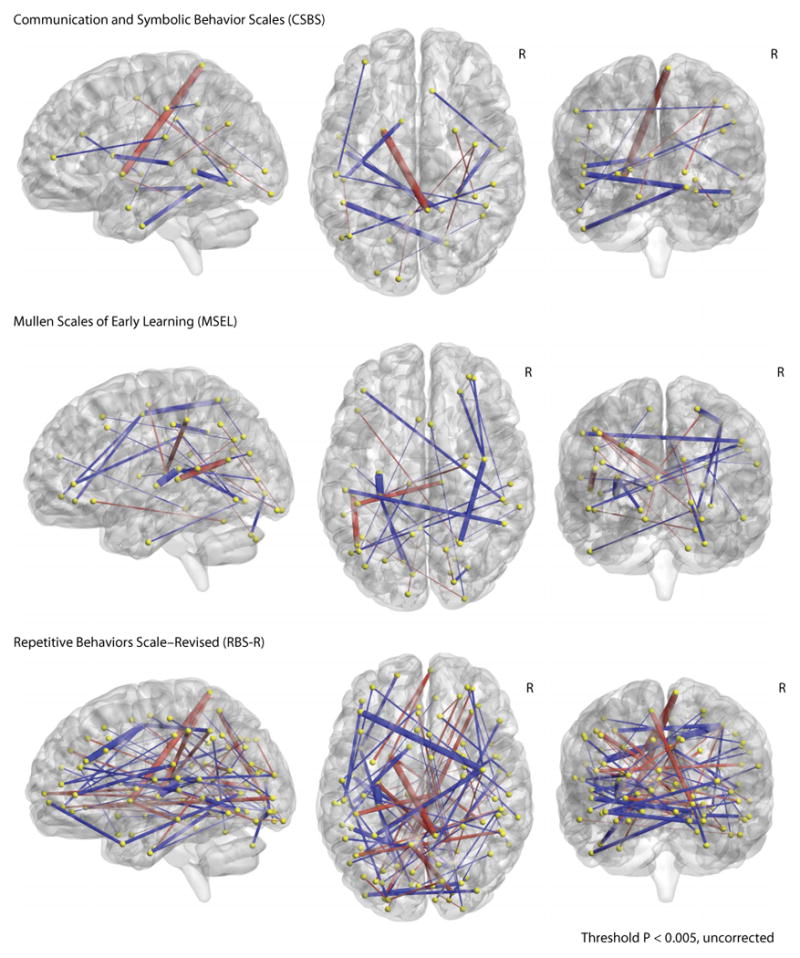
Autism spectrum disorder (ASD) is a neurodevelopmental disorder characterized by social deficits and repetitive behaviors that typically emerge by 24 months of age. To develop effective early interventions that can potentially ameliorate the defining deficits of ASD and improve long-term outcomes, early detection is essential. Using prospective neuroimaging of 59 6-month-old infants with a high familial risk for ASD, we show that functional connectivity magnetic resonance imaging correctly identified which individual children would receive a research clinical best-estimate diagnosis of ASD at 24 months of age. Functional brain connections were defined in 6-month-old infants that correlated with 24-month scores on measures of social behavior, language, motor development, and repetitive behavior, which are all features common to the diagnosis of ASD. A fully cross-validated machine learning algorithm applied at age 6 months had a positive predictive value of 100% [95% confidence interval (CI), 62.9 to 100], correctly predicting 9 of 11 infants who received a diagnosis of ASD at 24 months (sensitivity, 81.8%; 95% CI, 47.8 to 96.8). All 48 6-month-old infants who were not diagnosed with ASD were correctly classified [specificity, 100% (95% CI, 90.8 to 100); negative predictive value, 96.0% (95% CI, 85.1 to 99.3)]. These findings have clinical implications for early risk assessment and the feasibility of developing early preventative interventions for ASD.
Copyright © 2017, American Association for the Advancement of Science.
Figures
References
-
- American Psychiatric Association, editor. Diagnostic and Statistical Manual of Mental Disorders. 5. American Psychiatric Association; 2013.
-
- Developmental, Disabilities Monitoring Network Surveillance Year, and 2010 Principal Investigators, Prevalence of autism spectrum disorder among children aged 8 years-autism and developmental disabilities monitoring network. Morbidity and Mortality Weekly Report, Surveillance Summaries. 2002 - PubMed
-
- Ganz ML. The lifetime distribution of the incremental societal costs of autism. Arch Pediatr Adolesc Med. 2007;161:343–349. - PubMed
-
- Buescher AVS, Cidav Z, Knapp M, Mandell DS. Costs of autism spectrum disorders in the United Kingdom and the United States. JAMA Pediatr. 2014;168:721–728. - PubMed
Publication types
MeSH terms
Grants and funding
LinkOut - more resources
Full Text Sources
Other Literature Sources
Medical
