. 2017 Jun 7;9(393):eaal4922.
doi: 10.1126/scitranslmed.aal4922.

Combined immune checkpoint blockade as a therapeutic strategy for BRCA1-mutated breast cancer

Affiliations

Combined immune checkpoint blockade as a therapeutic strategy for BRCA1-mutated breast cancer

Emma Nolan et al. Sci Transl Med. .

Abstract

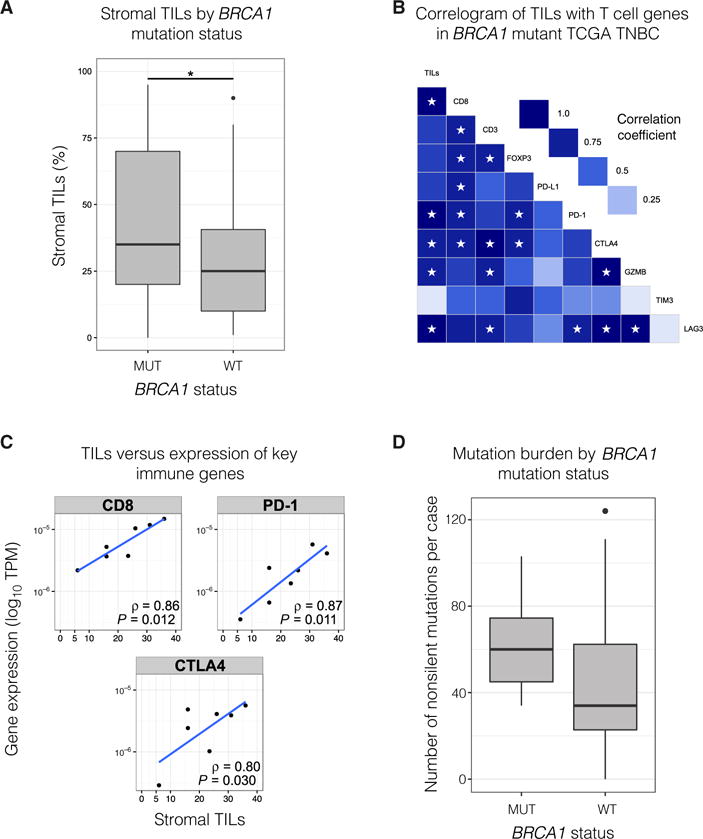
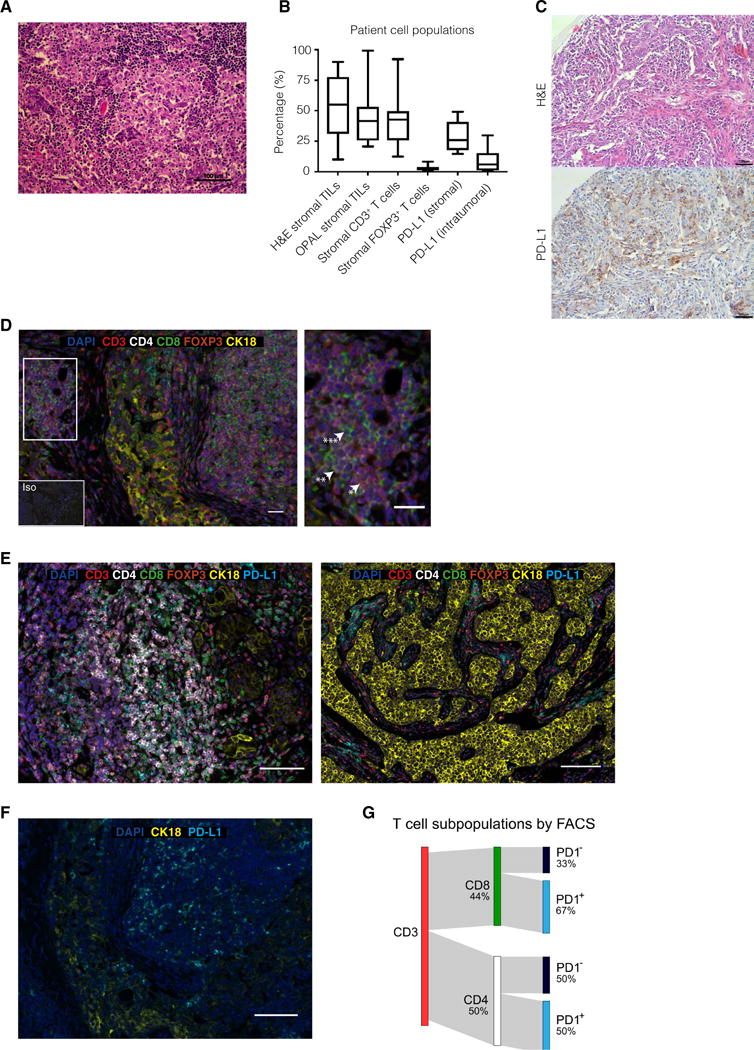
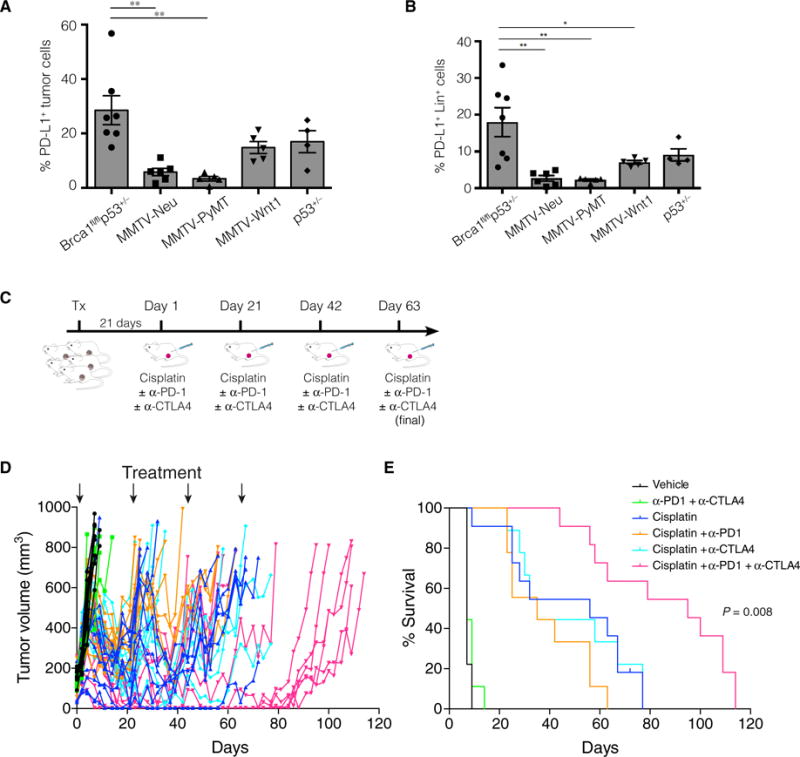
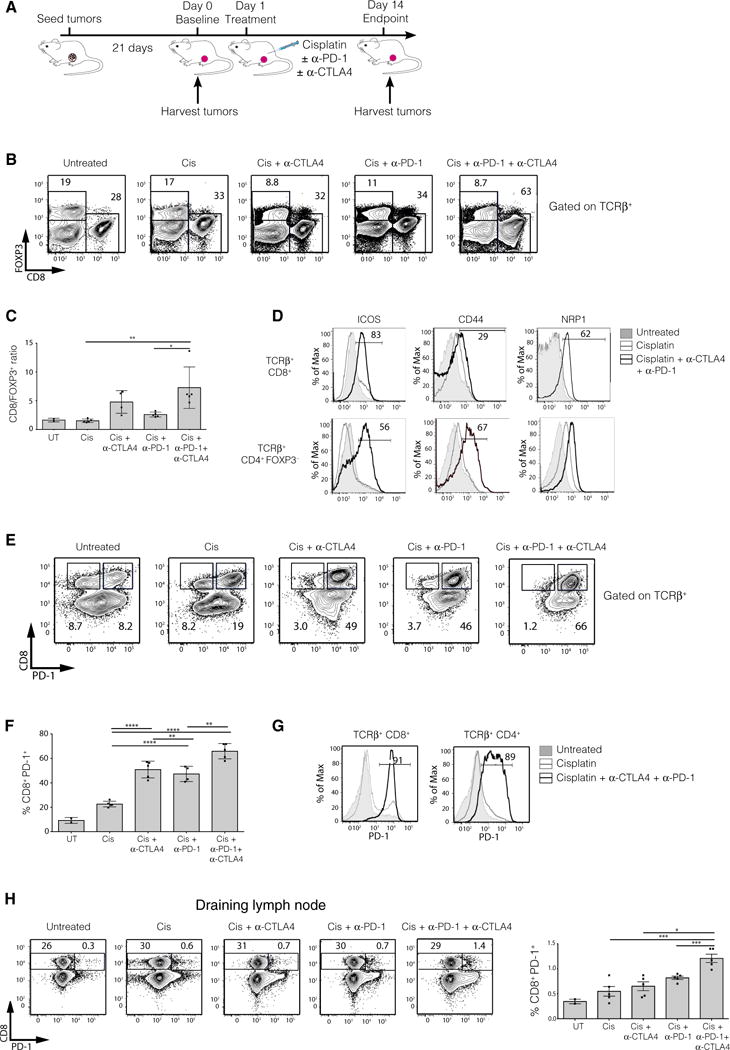
Immune checkpoint inhibitors have emerged as a potent new class of anticancer therapy. They have changed the treatment landscape for a range of tumors, particularly those with a high mutational load. To date, however, modest results have been observed in breast cancer, where tumors are rarely hypermutated. Because BRCA1-associated tumors frequently exhibit a triple-negative phenotype with extensive lymphocyte infiltration, we explored their mutational load, immune profile, and response to checkpoint inhibition in a Brca1-deficient tumor model. BRCA1-mutated triple-negative breast cancers (TNBCs) exhibited an increased somatic mutational load and greater numbers of tumor-infiltrating lymphocytes, with increased expression of immunomodulatory genes including PDCD1 (PD-1) and CTLA4, when compared to TNBCs from BRCA1-wild-type patients. Cisplatin treatment combined with dual anti-programmed death-1 and anti-cytotoxic T lymphocyte-associated antigen 4 therapy substantially augmented antitumor immunity in Brca1-deficient mice, resulting in an avid systemic and intratumoral immune response. This response involved enhanced dendritic cell activation, reduced suppressive FOXP3+ regulatory T cells, and concomitant increase in the activation of tumor-infiltrating cytotoxic CD8+ and CD4+ T cells, characterized by the induction of polyfunctional cytokine-producing T cells. Dual (but not single) checkpoint blockade together with cisplatin profoundly attenuated the growth of Brca1-deficient tumors in vivo and improved survival. These findings provide a rationale for clinical studies of combined immune checkpoint blockade in BRCA1-associated TNBC.


Conflict of interest statement

Competing interests: No potential conflicts of interest were disclosed by the other authors.

Figures

Fig. 1
Fig. 1. BRCA1-mutated TNBCs are enriched for TILs and have a high mutational burden
(A) Stromal TILs in BRCA1-mutated (n = 29) versus WT primary TNBC (n = 64). P = 0.037 (Mann-Whitney U test). The combined cohort was from TCGA (n = 71) and a kConFab series of BRCA1-mutant tumors (n = 22). (B) Correlogram of stromal TILs and expression of key immune genes in BRCA1-mutant primary TNBC (n = 7). Stars indicate P < 0.05. Gene expression measured in transcripts per million (TPM). Pearson product-moment correlation coefficient is displayed. (C) Scatter plots of TILs versus TPM (logarithmic scale) for key immune genes [same data as (B)]. (D) Nonsilent mutation (missense/nonsense mutations and indels) burden in BRCA1-mutant (n = 7) versus WT primary TNBC from TCGA cohort (n = 64). P = 0.05 (Mann-Whitney U test). Refer to Materials and Methods for details on box plots.
Fig. 2
Fig. 2. BRCA1-mutated TNBCs exhibit prominent lymphocytic infiltrate and PD-L1 expression
(A) Representative H&E image of a BRCA1-mutated TNBC. Scale bar, 100 μm. (B) Analysis of matched BRCA1-positive TNBC patient stromal TIL populations for H&E, OPAL staining, stromal, and intratumoral PD-L1 expression (n = 16). (C) BRCA1-mutated TNBC. H&E and accompanying section immunostained for PD-L1. Scale bars, 100 mm. (D) Representative BRCA1-mutated TNBC patient sample with high stromal TILs. The inset indicates an area with a high number of CD3+ (*), CD4+ (**), and CD8+ (***) cells. Iso, isotype-matched control antibody. Additional images are shown in fig. S1 (A and B). Scale bars, 100 mm (main image) and 20 μm (inset). (E) BRCA1-mutated TNBCs. The OPAL staining panel includes tumor marker CK18 (yellow), CD3 (red), CD4 (white), CD8 (green), FOXP3 (orange), PD-L1 (cyan), and 4′,6-diamidino-2-phenylindole (DAPI) (blue). Scale bars, 100 μm. (F) OPAL staining for PD-L1 and CK18, revealing high intratumoral PD-L1 expression. Scale bar, 100 μm. (G) Sankey plot of a fluorescence-activated cell sorting (FACS) profile of CD3+ TILs from a BRCA1-mutated tumor, showing percentages of CD8+ and CD4+ cells and PD-1 expression within these subsets (see fig. S1C).
Fig. 3
Fig. 3. Combination therapy with checkpoint inhibitors curtails the growth of Brca1-deficient tumors
Graph depicting the percentages of PD-L1+ (A) tumor cells and (B) stromal cells (Lin+) within mammary tumors harvested from MMTV-cre/Brca1fl/fl/p53+/, MMTV-Neu, MMTV-PyMT, MMTV-Wnt1, and p53+/ mice. PD-L1 expression was determined by flow cytometry on freshly harvested tumors, and the percentage of positive cells was determined by comparing PD-L1 expression to an isotype-matched control antibody. Data are means ± SEM; each data point depicts an individual tumor. *P < 0.05, **P < 0.01. (C) Overview of treatment strategy: Freshly harvested MMTV-cre/Brca1fl/fl/p53+/ tumor cells were injected into the mammary fat pads of syngeneic (F1 FVB × BALB/c) mice. Three weeks after transplantation, mice were randomized to one of six treatment arms: (i) vehicle (PBS), (ii) anti–PD-1 and anti-CTLA4, (iii) cisplatin, (iv) cisplatin and anti–PD-1, (v) cisplatin and anti-CTLA4, and (vi) cisplatin, anti-CTLA4, and anti–PD-1. Mice received cisplatin on day 1 of each treatment cycle (days 1, 21, 42, and 63) and anti–PD-1 and anti-CTLA4 on days 2, 5, and 8 of each cycle. (D) Tumor growth curves for individual mice (n = 58). Arrows depict day 1 of a treatment cycle (treatment with cisplatin or vehicle control). (E) Kaplan-Meier survival curves depicting the augmented response of MMTV-cre/Brca1fl/fl/p53+/ tumors to combination therapy. Log-rank (Mantel-Cox) P value is shown for combination cisplatin, anti–PD-1, and anti-CTLA4 therapy versus cisplatin alone.
Fig. 4
Fig. 4. Combination therapy induces an avid immune response in Brca1-deficient tumors
(A) Schematic diagram of the experimental protocol. MMTV-cre/Brca1fl/fl/p53+/ tumor cells were transplanted into the fat pads of syngeneic (F1 FVB × BALB/c) mice. Tumors, spleens, and draining lymph nodes were either harvested before treatment initiation (baseline, day 0) or 14 days after treatment with cisplatin ± anti-CTLA4/anti–PD-1. The composition and activation status of immune cells were assessed by flow cytometry. Two independent experiments were performed (n = 5 mice per group per experiment). (B) Representative FACS plots showing FOXP3 versus CD8 expression on TCRβ+ tumor-infiltrating cells in mice receiving the treatments indicated. The percentage of cells bounded by each region is shown. (C) Quantification of the ratio of CD8+/FOXP3+ T cells infiltrating the tumors of mice receiving the various treatments. UT, untreated. (D) Histograms of ICOS, CD44, and NRP1 expression on tumor-infiltrating CD8+ (top panels) or CD4+FOXP3 (bottom panels) conventional T cells from untreated mice (gray shaded), mice treated with cisplatin (gray line), or mice treated with cisplatin, anti-CTLA4, and anti–PD-1 (black line). (E) Representative FACS plots depicting CD8 versus PD-1 expression on TCRβ+ tumor-infiltrating cells in mice receiving the treatments indicated. The percentage of cells bounded by each region is shown. (F) Quantification of the proportion of PD-1+ tumor-infiltrating CD8+ T cells. (G) Histograms of PD-1 expression on tumor-infiltrating CD8+ or CD4+ conventional T cells from untreated mice(gray shaded), mice treated with cisplatin (gray line), or mice treated with cisplatin, anti-CTLA4, and anti–PD-1 (black line). (H) Expression of PD-1 versus CD8 on TCRβ+ T cells from the draining lymph nodes of mice receiving the indicated treatments (left panels) and quantification of PD-1+CD8+ T cells (right panel). Flow cytometric analysis is representative of two experiments with n = 5 mice per group. Means ± SEM are shown, with analysis by one-way analysis of variance (ANOVA) and Tukey’s post-test. *P < 0.05, **P < 0.001, ***P < 0.0001, ****P < 0.00001.

Comment in

  • Immunotherapy: Keeping breast cancer in check.
    Lieben L. Lieben L. Nat Rev Cancer. 2017 Aug;17(8):454-455. doi: 10.1038/nrc.2017.55. Epub 2017 Jul 7. Nat Rev Cancer. 2017. PMID: 28684877 No abstract available.
  • Doubling Down on BRCA-Mutated Cancer.
    Wahner Hendrickson AE, Kaufmann SH, Swisher EM. Wahner Hendrickson AE, et al. Trends Cancer. 2017 Nov;3(11):743-744. doi: 10.1016/j.trecan.2017.09.005. Epub 2017 Sep 29. Trends Cancer. 2017. PMID: 29120748

References

    1. Foulkes WD, Smith IE, Reis-Filho JS. Triple-negative breast cancer. N Engl J Med. 2010;363:1938–1948. - PubMed
    1. Lord CJ, Ashworth A. BRCAness revisited. Nat Rev Cancer. 2016;16:110–120. - PubMed
    1. Bouwman P, Jonkers J. Molecular pathways: How can BRCA-mutated tumors become resistant to PARP inhibitors? Clin Cancer Res. 2014;20:540–547. - PubMed
    1. Schreiber RD, Old LJ, Smyth MJ. Cancer immunoediting: Integrating immunity’s roles in cancer suppression and promotion. Science. 2011;331:1565–1570. - PubMed
    1. Topalian SL, Drake CG, Pardoll DM. Immune checkpoint blockade: A common denominator approach to cancer therapy. Cancer Cell. 2015;27:450–461. - PMC - PubMed

Publication types

MeSH terms