Meta-Analysis
. 2017 Jul;106(1):263-275.
doi: 10.3945/ajcn.116.150094. Epub 2017 Jun 7.

Interaction between genes and macronutrient intake on the risk of developing type 2 diabetes: systematic review and findings from European Prospective Investigation into Cancer (EPIC)-InterAct

Affiliations
Meta-Analysis

Interaction between genes and macronutrient intake on the risk of developing type 2 diabetes: systematic review and findings from European Prospective Investigation into Cancer (EPIC)-InterAct

Sherly X Li et al. Am J Clin Nutr. 2017 Jul.

Abstract

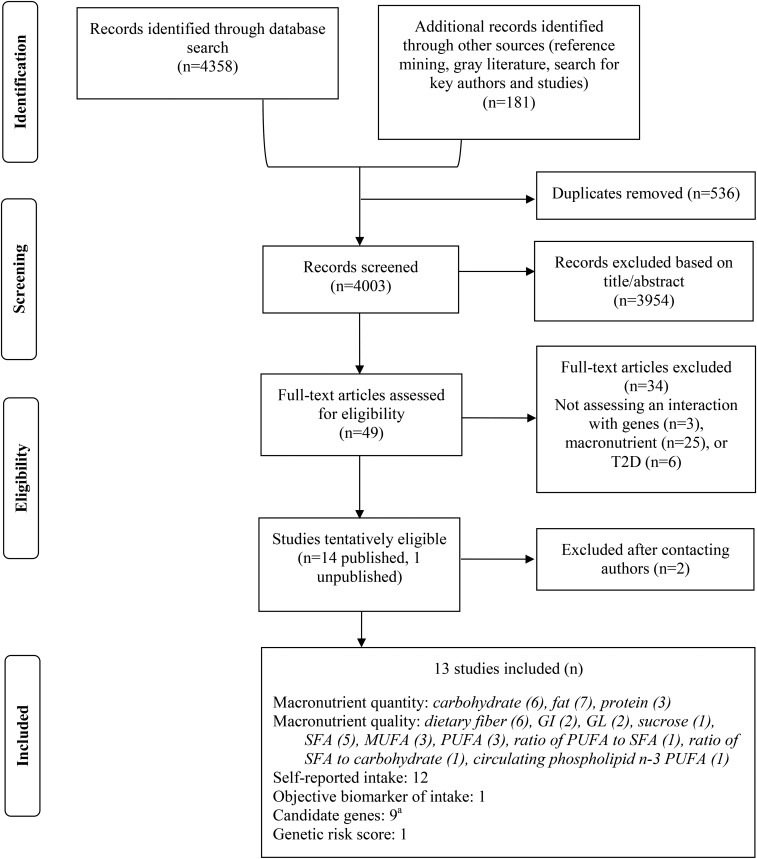
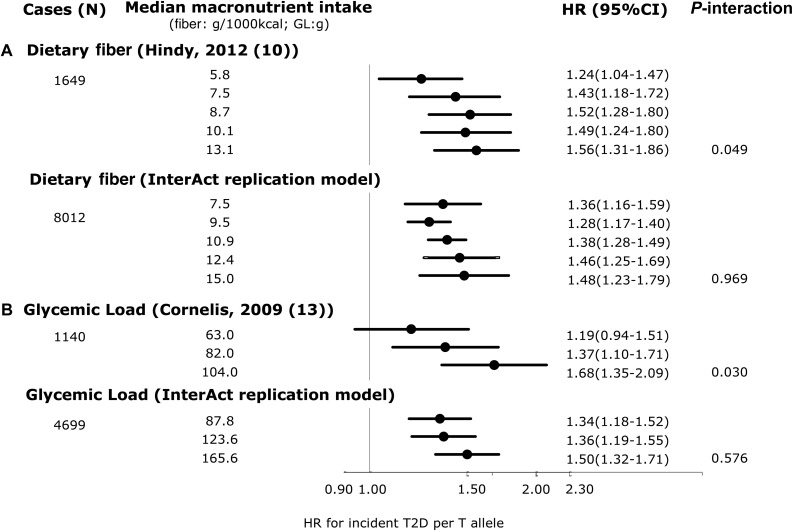
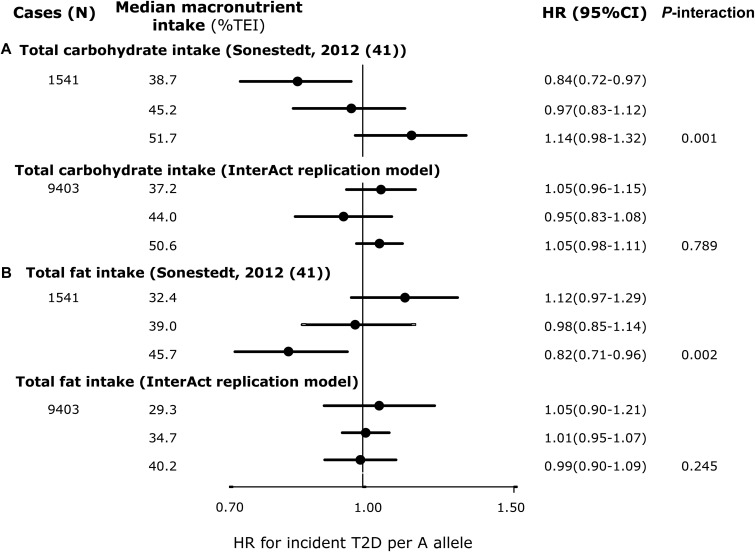
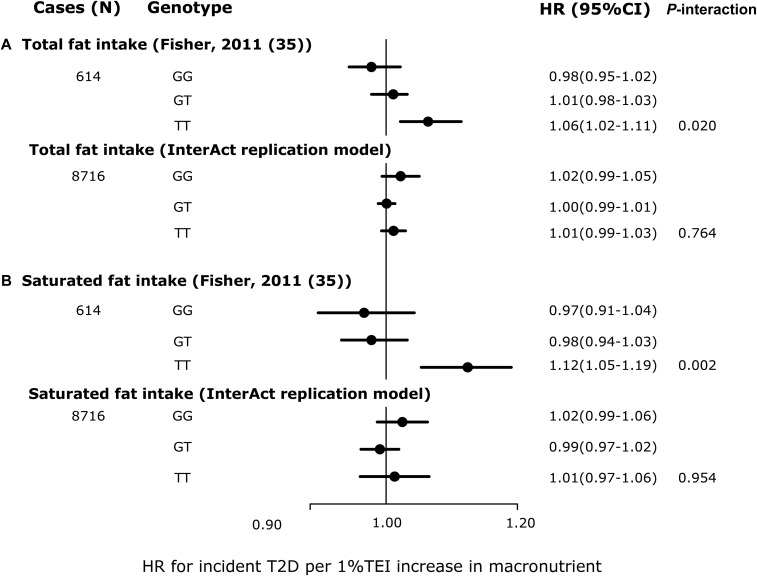
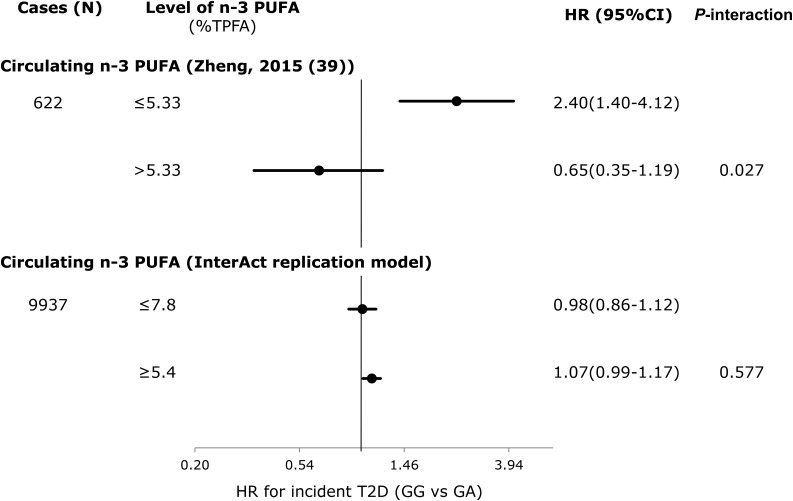
Background: Gene-diet interactions have been reported to contribute to the development of type 2 diabetes (T2D). However, to our knowledge, few examples have been consistently replicated to date.Objective: We aimed to identify existing evidence for gene-macronutrient interactions and T2D and to examine the reported interactions in a large-scale study.Design: We systematically reviewed studies reporting gene-macronutrient interactions and T2D. We searched the MEDLINE, Human Genome Epidemiology Network, and WHO International Clinical Trials Registry Platform electronic databases to identify studies published up to October 2015. Eligibility criteria included assessment of macronutrient quantity (e.g., total carbohydrate) or indicators of quality (e.g., dietary fiber) by use of self-report or objective biomarkers of intake. Interactions identified in the review were subsequently examined in the EPIC (European Prospective Investigation into Cancer)-InterAct case-cohort study (n = 21,148, with 9403 T2D cases; 8 European countries). Prentice-weighted Cox regression was used to estimate country-specific HRs, 95% CIs, and P-interaction values, which were then pooled by random-effects meta-analysis. A primary model was fitted by using the same covariates as reported in the published studies, and a second model adjusted for additional covariates and estimated the effects of isocaloric macronutrient substitution.Results: Thirteen observational studies met the eligibility criteria (n < 1700 cases). Eight unique interactions were reported to be significant between macronutrients [carbohydrate, fat, saturated fat, dietary fiber, and glycemic load derived from self-report of dietary intake and circulating n-3 (ω-3) polyunsaturated fatty acids] and genetic variants in or near transcription factor 7-like 2 (TCF7L2), gastric inhibitory polypeptide receptor (GIPR), caveolin 2 (CAV2), and peptidase D (PEPD) (P-interaction < 0.05). We found no evidence of interaction when we tried to replicate previously reported interactions. In addition, no interactions were detected in models with additional covariates.Conclusions: Eight gene-macronutrient interactions were identified for the risk of T2D from the literature. These interactions were not replicated in the EPIC-InterAct study, which mirrored the analyses undertaken in the original reports. Our findings highlight the importance of independent replication of reported interactions.

Keywords: diabetes; diet; effect modification; gene; interaction; macronutrient; replication; systematic review.


Figures

FIGURE 1
FIGURE 1
Flow diagram of the systematic review for gene-macronutrient interactions and the risk of T2D. Numbers are not mutually exclusive. aThis does not include exploratory studies that examined many candidate genes. GI, glycemic index; GL, glycemic load; T2D, type 2 diabetes.
FIGURE 2
FIGURE 2
Interaction between genetic variants within TCF7L2 and dietary fiber or GL: comparison between studies by Hindy et al. (10) and Cornelis et al. (13) with EPIC-InterAct. (A) ORs from Hindy et al. (10) (top) and pooled HRs from EPIC-InterAct (bottom) for T2D per T allele of rs7903146 (TCF7L2) and quintiles of dietary fiber (expressed in g/1000 kcal). Hindy et al. (10) adjusted for age, sex, BMI, total energy intake, season, and method (dietary intake assessment method). The EPIC-InterAct replication model adjusted for age (equal to the underlying time scale), sex, study center, BMI, total energy intake, and season, excluding the Malmo EPIC-InterAct center. (B) ORs from Cornelis et al. (13) and HRs from EPIC-InterAct for T2D per T allele of rs12255372 (TCF7L2) by tertiles of GL (in grams). Cornelis et al. (13) adjusted for age, BMI, smoking status, alcohol intake, coffee consumption, menopausal status, physical activity, energy-adjusted ratio of PUFAs to SFAs, and trans fat and cereal fiber intake for women only. EPIC-InterAct adjusted for age (equal to the underlying time scale), study center, BMI, smoking status, alcohol intake, coffee consumption, menopausal status, physical activity, energy-adjusted ratio of PUFAs to SFAs, and cereal fiber intake. Given that Cornelis et al. (13) evaluated this interaction in a female cohort (Nurses’ Health Study), the EPIC-InterAct analysis was conducted for women only. P-interaction values for EPIC-InterAct were estimated by treating macronutrients and SNPs as continuous variables. Heterogeneity between countries was not significant in the EPIC-InterAct study (I2 = 0% and 1% in panels A and B, respectively). Two SNPs (rs7903146 and rs12255372) were in moderate linkage disequilibrium (CEU, r2 = 0.7). The sample size for the EPIC-InterAct analysis of the interaction between dietary fiber and TCF7L2 interaction was 18,292, whereas the sample size was 11,992 (women only) for the interaction between GL and TCF7L2. Multiplicative interaction analysis was performed with Prentice-weighted Cox regression. CEU, Northern Europeans from Utah; EPIC, European Prospective Investigation into Cancer; GL, glycemic load; SNP, single nucleotide polymorphism; T2D, type 2 diabetes; TCF7L2, transcription factor 7–like 2.
FIGURE 3
FIGURE 3
HRs of incident T2D per A allele of rs10423928 (GIPR) by tertiles of macronutrient intake: comparison between Sonestedt et al. (41) and EPIC-InterAct. (A and B) HRs from Sonestedt et al. (41) (top) and pooled HRs from EPIC-InterAct (bottom) for both total carbohydrate intake (A) and total fat intake (B). Sonestedt et al. (41) adjusted for age, sex, physical activity, education, smoking status, sex-specific alcohol categories, season, TEI, method, and BMI. EPIC-InterAct replication adjusted for age (equal to the underlying time scale), sex, center, physical activity, education, smoking status, sex-specific alcohol categories, season, TEI, and BMI. P-interaction values for EPIC-InterAct were estimated by treating macronutrients and rs10423928 as continuous variables. Heterogeneity between countries was not significant in the EPIC-InterAct study (I2 = 17% and 19% in panels A and B, respectively). The total sample size for the EPIC-InterAct analysis was 21,148. Multiplicative interaction analysis was performed with Prentice-weighted Cox regression. EPIC, European Prospective Investigation into Cancer; GIPR, gastric inhibitory polypeptide receptor; TEI, total energy intake; T2D, type 2 diabetes.
FIGURE 4
FIGURE 4
HRs of incident T2D per 1% TEI increase in macronutrient intake, stratified by CAV2 rs2270188 genotype: comparison between Fisher et al. (35) and EPIC-InterAct. HRs from Fisher et al. (35) (top) and pooled HRs from EPIC-InterAct (bottom) for both total fat intake (A) and saturated fat intake (B). Fisher et al. (35) adjusted for sex, age, TEI, and BMI (P-interaction values were obtained using results from the confirmatory case-cohort study under the additive genetic model). The EPIC-Interact replication model was adjusted for age (equal to the underlying time scale), sex, center, TEI, and BMI, excluding the EPIC-InterAct Potsdam center. To note, the classical interaction model was adopted, not the genotype-specific model reported in Fisher et al. (35), because of the stated equivalence of the 2. P-interaction values were estimated by treating macronutrients and rs2270188 as continuous variables. In the EPIC-InterAct study, heterogeneity between countries was moderate (I2 = 41% and 34% in panels A and B, respectively). The total sample size for the EPIC-InterAct analysis was 19,477. Multiplicative interaction analysis was performed using Prentice-weighted Cox regression. CAV2, caveolin 2; EPIC, European Prospective Investigation into Cancer; TEI, total energy intake; T2D, type 2 diabetes.
FIGURE 5
FIGURE 5
Interaction between genotypes for rs3786897 (PEPD: GA vs. GG) and the percentage of TPFAs that are circulating n–3 PUFAs: comparison between Zheng et al. (39) and EPIC-InterAct. ORs from Zheng et al. (39) (top) and pooled HRs from EPIC-InterAct (bottom) for T2D. Zheng et al. (39) adjusted for age and sex. The EPIC-InterAct replication model adjusted for age (equal to the underlying time scale), sex, and center. P-interaction values were estimated by treating circulating n–3 PUFAs as dichotomous and PEPD rs3786897 as continuous variables. In EPIC-InterAct, heterogeneity between countries was not significant (I2 =15%). The total sample size for the EPIC-InterAct analysis was 22,273. Multiplicative interaction analysis was performed with Prentice-weighted Cox regression. EPIC, European Prospective Investigation into Cancer; PEPD, peptidase D; TEI, total energy intake; TPFA, total phospholipid fatty acid; T2D, type 2 diabetes.

References

    1. NCD-RisC. Worldwide trends in diabetes since 1980: a pooled analysis of 751 population-based studies with 4·4 million participants. Lancet 2016;387:1513–30. - PMC - PubMed
    1. Kahn SE, Cooper ME, Del Prato S. Pathophysiology and treatment of type 2 diabetes: perspectives on the past, present, and future. Lancet 2014;383:1068–83. - PMC - PubMed
    1. Schellenberg ES, Dryden DM, Vandermeer B, Ha C, Korownyk C. Lifestyle interventions for patients with and at risk for type 2 diabetes: a systematic review and meta-analysis. Ann Intern Med 2013;159:543–51. - PubMed
    1. Ramachandran A, Snehalatha C, Mary S, Mukesh B, Bhaskar AD, Vijay V; Indian Diabetes Prevention Programme (IDPP). The Indian Diabetes Prevention Programme shows that lifestyle modification and metformin prevent type 2 diabetes in Asian Indian subjects with impaired glucose tolerance (IDPP-1). Diabetologia 2006;49:289–97. - PubMed
    1. Li G, Zhang P, Wang J, An Y, Gong Q, Gregg EW, Yang W, Zhang B, Shuai Y, Hong J, et al. Cardiovascular mortality, all-cause mortality, and diabetes incidence after lifestyle intervention for people with impaired glucose tolerance in the Da Qing Diabetes Prevention Study: a 23-year follow-up study. Lancet Diabetes Endocrinol 2014;2:474–80. - PubMed

MeSH terms