. 2017 Jul 7;28(14):1924-1936.
doi: 10.1091/mbc.E16-12-0875. Epub 2017 Jun 7.

Rear-polarized Wnt5a-receptor-actin-myosin-polarity (WRAMP) structures promote the speed and persistence of directional cell migration

Affiliations

Rear-polarized Wnt5a-receptor-actin-myosin-polarity (WRAMP) structures promote the speed and persistence of directional cell migration

Mary Katherine Connacher et al. Mol Biol Cell. .

Abstract

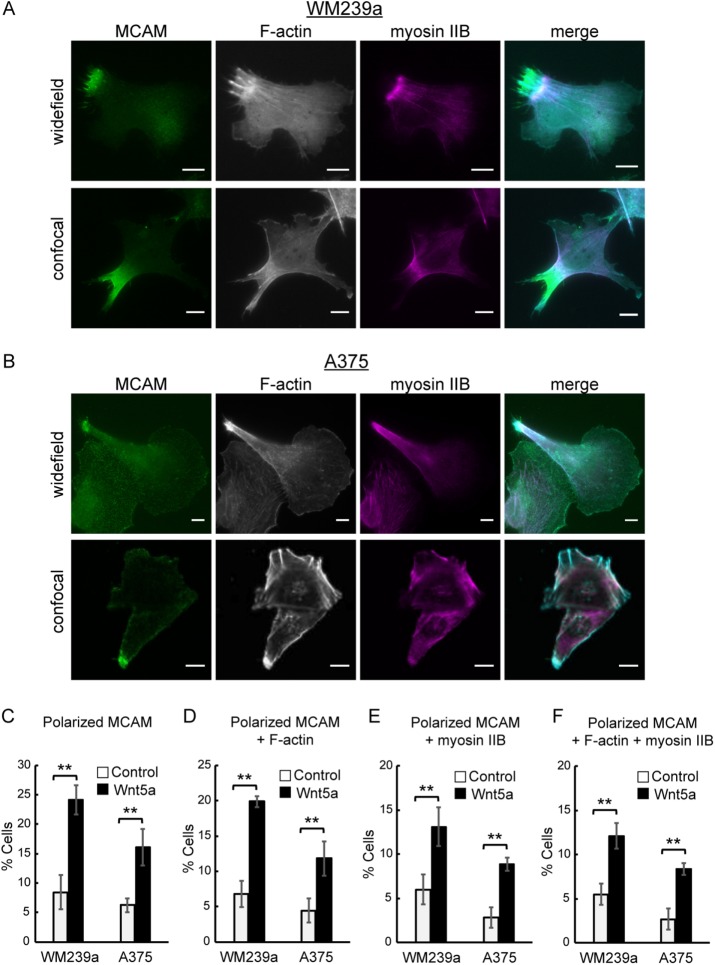
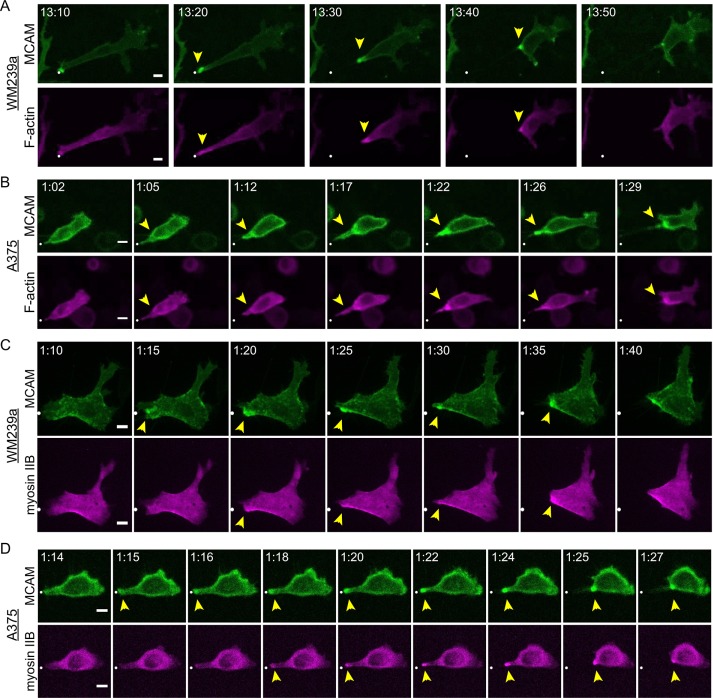
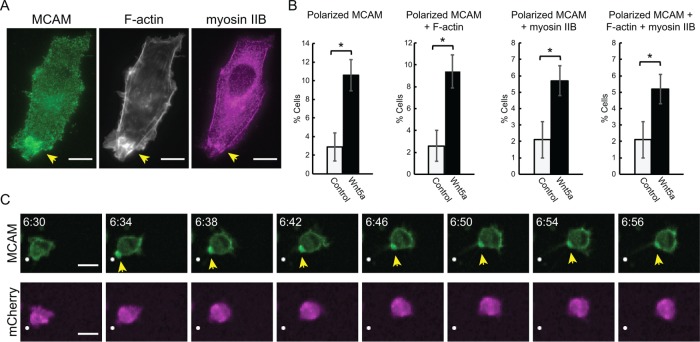
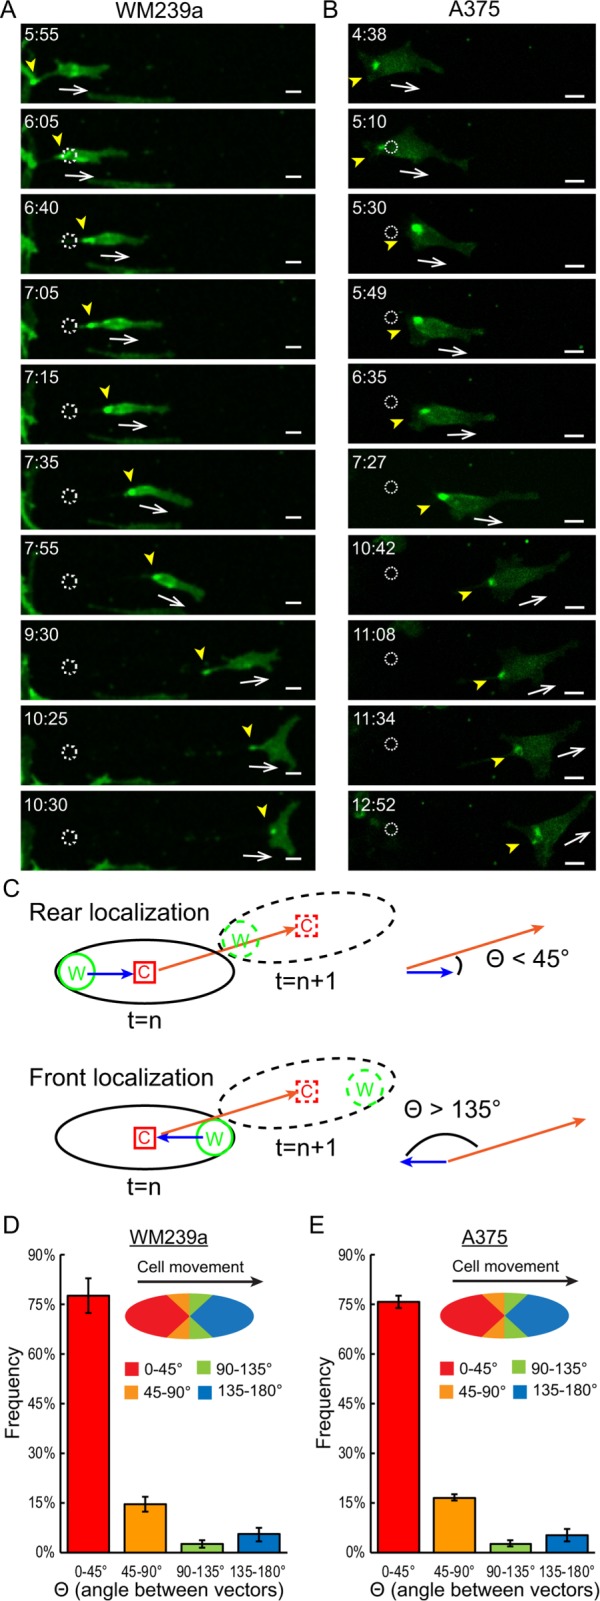
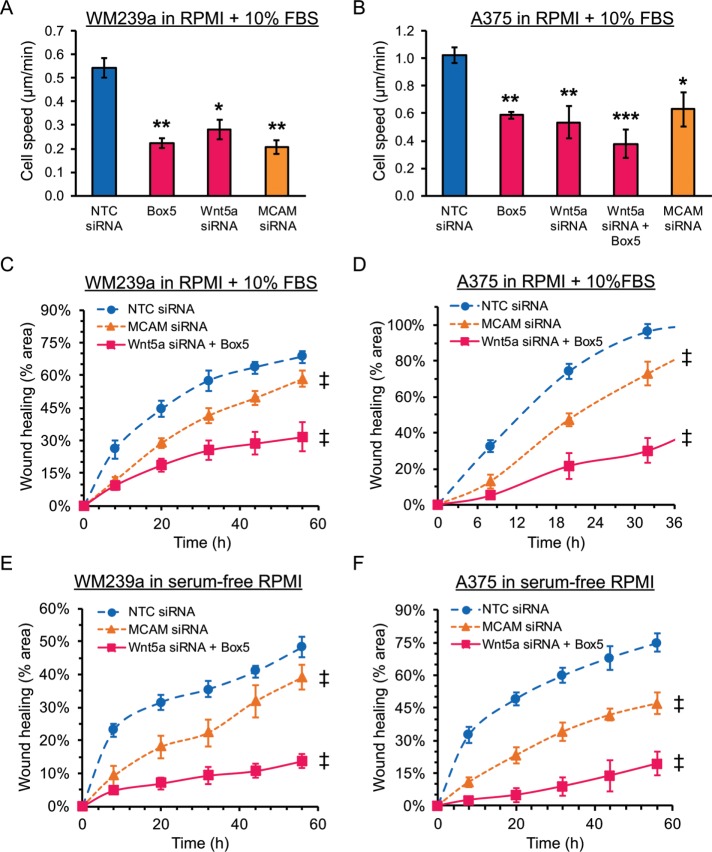
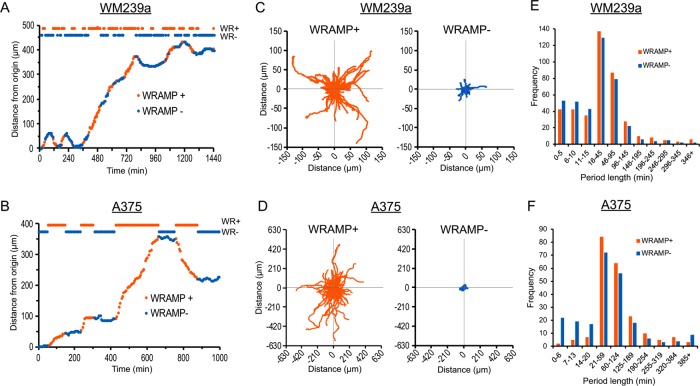
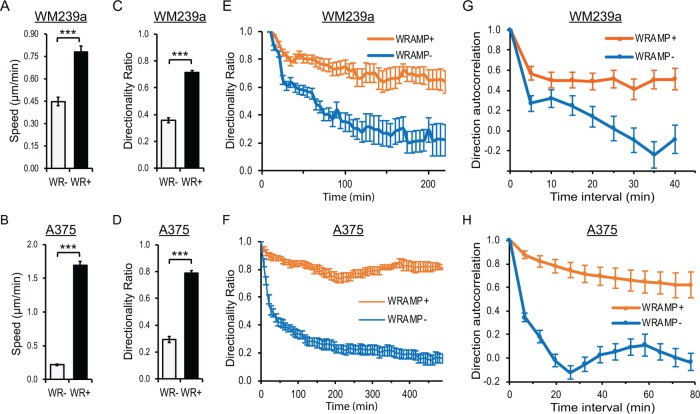
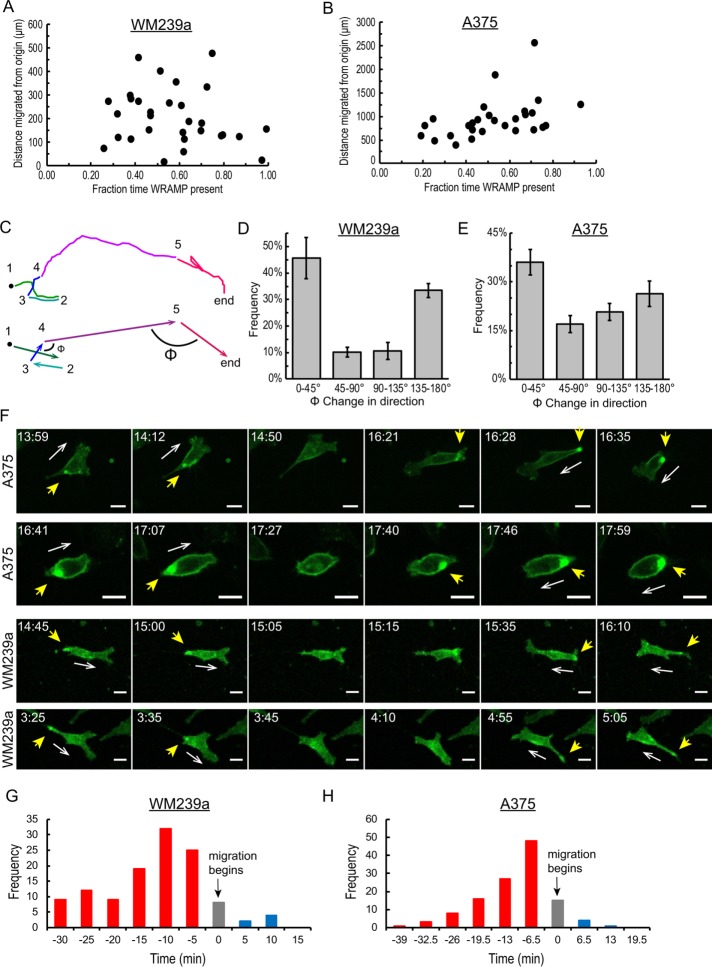
In contrast to events at the cell leading edge, rear-polarized mechanisms that control directional cell migration are poorly defined. Previous work described a new intracellular complex, the Wnt5a-receptor-actomyosin polarity (WRAMP) structure, which coordinates the polarized localization of MCAM, actin, and myosin IIB in a Wnt5a-induced manner. However, the polarity and function for the WRAMP structure during cell movement were not determined. Here we characterize WRAMP structures during extended cell migration using live-cell imaging. The results demonstrate that cells undergoing prolonged migration show WRAMP structures stably polarized at the rear, where they are strongly associated with enhanced speed and persistence of directional movement. Strikingly, WRAMP structures form transiently, with cells displaying directional persistence during periods when they are present and cells changing directions randomly when they are absent. Cells appear to pause locomotion when WRAMP structures disassemble and then migrate in new directions after reassembly at a different location, which forms the new rear. We conclude that WRAMP structures represent a rear-directed cellular mechanism to control directional migration and that their ability to form dynamically within cells may control changes in direction during extended migration.


Figures

FIGURE 1:
FIGURE 1:
WRAMP structures are made up of polarized MCAM, F-actin, and myosin IIB. Monitoring of endogenous MCAM and myosin IIB by indirect immunofluorescence and F-actin by phalloidin staining in (A) WM239a cells and (B) A375 cells. Top, wide-field imaging (60×). Bottom, confocal imaging (100×). Scale bars, 10 µm. Merge, MCAM in green, F-actin in cyan, and myosin IIB in magenta. (C–F) Cells treated without or with 250 ng/ml Wnt5a for 30 min: percentages of cells with (C) polarized MCAM, (D) F-actin polarized along with MCAM, (E) myosin IIB polarized along with MCAM, and (F) both F-actin and myosin IIB polarized along with MCAM. Mean percentages and SEM from three or more slides (>750 cells), representing two or more biological replicates. **p < 0.01. The p values were calculated using standard two-tailed Student’s t test. The term “polarized” in this figure does not distinguish between rear and front polarity.
FIGURE 2:
FIGURE 2:
Dynamic movement of WRAMP structures, followed by membrane retraction. Frames from confocal live-cell imaging experiments of (A) WM239a and (B) A375 cells cotransfected with MCAM-GFP and LifeAct-mCherry and (C) WM239a and (D) A375 cells cotransfected with MCAM-GFP and myosin IIB-N18-mCherry. Supplemental Movies S2–S5 (corresponding to A–D, respectively) show coordinated movement of MCAM, F-actin, and myosin IIB. White dot indicates starting position. Scale bars, 10 µm; times in hours:minutes. Controls for this experiment with MCAM-GFP plus mCherry in Supplemental Figure S1 and Supplemental Movies S6 and S7. Quantitation of MCAM-GFP and myosin IIB-mCherry (or LifeAct-mCherry) fluorescence vs. time is shown in Supplemental Figure S2.
FIGURE 3:
FIGURE 3:
WRAMP structures in HT1080 cells. (A) Wide-field imaging (60×) of endogenous MCAM, F-actin, and myosin IIB in fixed HT1080 cells. Scale bars, 10 µm. (B) Cells treated without or with Wnt5a (250 ng/ml, 30 min) showing percentages of all cells with polarized MCAM, F-actin polarized along with MCAM, myosin IIB polarized along with MCAM, and F-actin plus myosin IIB polarized along with MCAM. Values show means and SEM from four or more slides (>800 cells) representing two or more biological replicates. *p < 0.05. The p values were calculated using standard two-tailed Student’s t test. (C) Live-cell imaging of HT1080 cells cotransfected with MCAM-GFP plus mCherry (also see Supplemental Movie S8) shows formation of WRAMP structures, followed by membrane retraction, not artifacts of cell volume or membrane thickness. Scale bars, 10 μm; times in hours:minutes.
FIGURE 4:
FIGURE 4:
WRAMP structures are maintained at the rear during extended cell migration. Confocal live-cell imaging of MCAM-GFP in (A) WM239a cells and (B) A375 cells treated with recombinant Wnt5a, and monitored during extended migration by at least two cell lengths into scratch wounds. Yellow arrowheads mark WRAMP structures, dotted circles indicate starting position for the cell center, and white arrows indicate direction of cell movement. Supplemental Movies S9 and S10 correspond to A and B, respectively. Scale bars, 20 μm; times in hours:minutes. (C) Method for measuring WRAMP structure polarity. W indicates the position of WRAMP structures, measured by polarized MCAM; C indicates the position of the cell center; solid black line indicates the cell outline in frame n; dashed black line indicates the cell outline at frame n + 1. The red arrow depicts the movement vector, indicating the direction of cell movement from the cell center in frame n to frame n + 1. The blue arrow depicts the positioning vector, indicating the WRAMP structure position relative to the cell center. The polarity score measures the angle between these two vectors (Θ), where Θ ≤ 45° indicates rear polarity of WRAMP structures and Θ ≥ 135° indicates front polarity. (D, E) Histograms showing polarity scores for (D) WM239a and (E) A375 cells, measuring the mean for ≥30 cells (>2000 frames). Error bars indicate the range from biological replicates imaged in different experiments. All cells showed similar distributions, with primarily rear localization and only a small percentage of frames with side or front localization. Generally, WRAMP structures were found at the side or front only when cells were not migrating or before changing direction.
FIGURE 5:
FIGURE 5:
Effect of blocking WRAMP structures on cell speed and wound healing. To measure cell speed, (A) WM239a and (B) A375 cells were transfected with PB-H2B-mCherry and seeded on glass-bottom 96-well plates, followed by scratch wounding. Every cell that migrated into the wound was tracked using a cell-tracking algorithm, calculating movement speed for individual cells. Bars show the mean and SEM from three wells (>360 cells/condition for WM239a cells and >180 cells/condition for A375 cells). *p < 0.01 and **p < 0.005. The p values were calculated using standard two-tailed Student’s t test. (C–F) Scratch wound assays were used to measure of the effects of suppressing Wnt5a signaling and MCAM expression on wound healing. Cells were imaged using bright-field microscopy in plastic 96-well dishes, and four wells were measured for each condition at various time points. We quantified (C) WM239a and (D) A375 cells in the presence of 10% FBS and (E) WM239a and (F) A375 cells in the absence of serum. Two-way analysis of variance was used to determine the significance between the treatments and nontargeting siRNA control across the time points. Treatment is significantly different compared with nontargeting control (NTC) siRNA with p < 0.0001.
FIGURE 6:
FIGURE 6:
Migrating cells fluctuate between periods when WRAMP structures are present and periods when they are absent. (A, B) Trajectories for single representative (A) WM239a and (B) A375 cells, showing distance from origin vs. time. Periods when WRAMP structures are present (WRAMP+, orange) and absent (WRAMP–, blue) are indicated in trajectory plots and projections at the top, where each point represents one frame. (C, D) Cell trajectories for 250 WRAMP+ and 250 WRAMP– segments, each observed in (C) 28 WM239a and (D) 28 A375 cells. Cell position at the start of each segment starts at 0, 0 and follows trajectories to the end of the segment. (E, F) Lengths of periods in minutes for WRAMP+ and WRAMP– segments from (E) 30 WM239a and (F) 30 A375 cells. Histograms show similar period lengths between WRAMP+ and WRAMP– segments. All cells were treated with recombinant Wnt5a at the start of the experiment.
FIGURE 7:
FIGURE 7:
Quantitative measurements of cell movement. (A, B) Cell speed during WRAMP+ (WR+) and WRAMP– (WR–) segments were calculated in (A) WM239a (30 cells) and (B) A375 cells (30 cells). Values report mean and SEM, ***p < 0.0001. The p values were calculated using standard two-tailed Student’s t test. (C, D) Directionality ratio calculated at the final time point in WRAMP+ and WRAMP– segments; mean and SEM for 30 (C) WM239a and (D) A375 cells. The p values were calculated using standard two-tailed Student’s t test, ***p < 0.0001. (E, F) Directionality ratio calculated vs. time for WRAMP+ and WRAMP– segments in (E) WM239a and (F) A375 cells. (G, H) Direction autocorrelation of trajectories for WRAMP+ and WRAMP– segments at least 12 frames long in 30 (G) WM239a and (H) A375 cells. Error bars indicate SEM. All cells were treated with recombinant Wnt5a at the start of the experiment.
FIGURE 8:
FIGURE 8:
Cells change direction during WRAMP– segments. (A, B) Plots of distance from origin over the entire cell trajectory vs. fraction of time with WRAMP+ segments show little correlation in 30 (A) WM239a and (B) A375 cells. (C) Example of cell trajectory, showing changes in direction between consecutive WRAMP+ segments (arrows), measured by angle Φ. (D, E) Histogram of the angle Φ, showing the changes in direction between >600 consecutive WRAMP+ segments for (D) 30 WM239a and (E) 30 A375 cells. Bars represent the mean and range for two biological replicates each tracking 30 cells (>600 values). (F) Confocal live-cell imaging of MCAM-GFP in A375 and WM239a cells (also see Supplemental Movie S11) shows changes in cell direction during periods when WRAMP structures are absent. The dynamic movement of the WRAMP structure allows intracellular repositioning within the cell before migration in a new direction. Yellow arrowheads indicate WRAMP structures scored by MCAM-GFP; white arrows indicate direction of cell movement. Scale bar, 20 μm; times in hours:minutes. All cells were treated with recombinant Wnt5a at the start of the experiment. (G, H) Histograms showing the times at which WRAMP structures reappear relative to the start of migration in a new direction in (G) WM239a (n = 120 cases across 30 cells; frames acquired every 5.0 min) and (H) A375 cells (n = 123 cases across 30 cells; frames acquired every 6.5 min). Red indicates cells where WRAMP structures reappeared before the start of migration. Gray indicates WRAMP structures reappearing in the same frame in which cells begin migrating. Blue indicates WRAMP structures reappearing after cells begin migrating.

References

    1. Bittner M, Meltzer P, Chen Y, Jiang Y, Seftor E, Hendrix M, Radmacher M, Simon R, Yakhini Z, Ben-Dor A, et al. Molecular classification of cutaneous malignant melanoma by gene expression profiling. Nature. 2000;406:536–540. - PubMed
    1. Bowerman B. Cell signaling. Wnt moves beyond the canon. Science. 2008;320:327–328. - PMC - PubMed
    1. Cramer LP. Forming the cell rear first: breaking cell symmetry to trigger directed cell migration. Nat Cell Biol. 2010;12:628–632. - PubMed
    1. Cramer LP. Mechanism of cell rear retraction in migrating cells. Curr Opin Cell Biol. 2013;25:591–599. - PubMed
    1. Gao B. Wnt regulation of planar cell polarity (PCP) Curr Top Dev Biol. 2012;101:263–295. - PubMed

LinkOut - more resources