. 2017 Jun 7;7(6):1665-1682.
doi: 10.1534/g3.117.041624.

Oas1b-dependent Immune Transcriptional Profiles of West Nile Virus Infection in the Collaborative Cross

Affiliations

Oas1b-dependent Immune Transcriptional Profiles of West Nile Virus Infection in the Collaborative Cross

Richard Green et al. G3 (Bethesda). .

Abstract

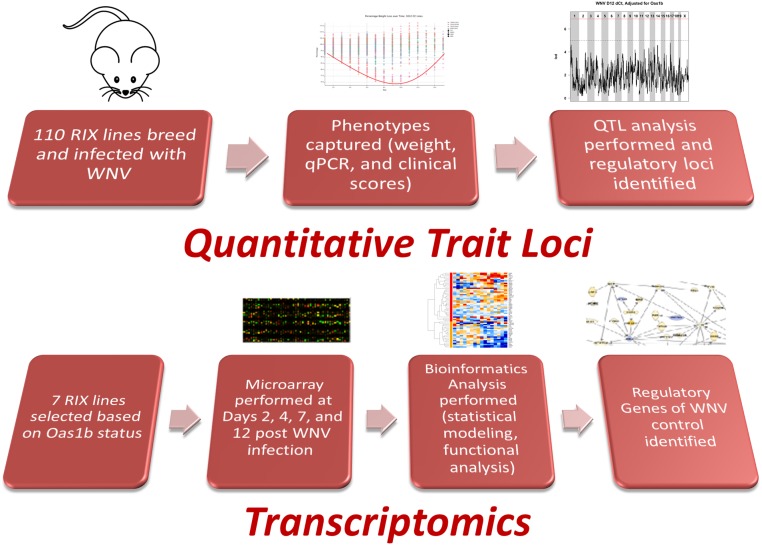
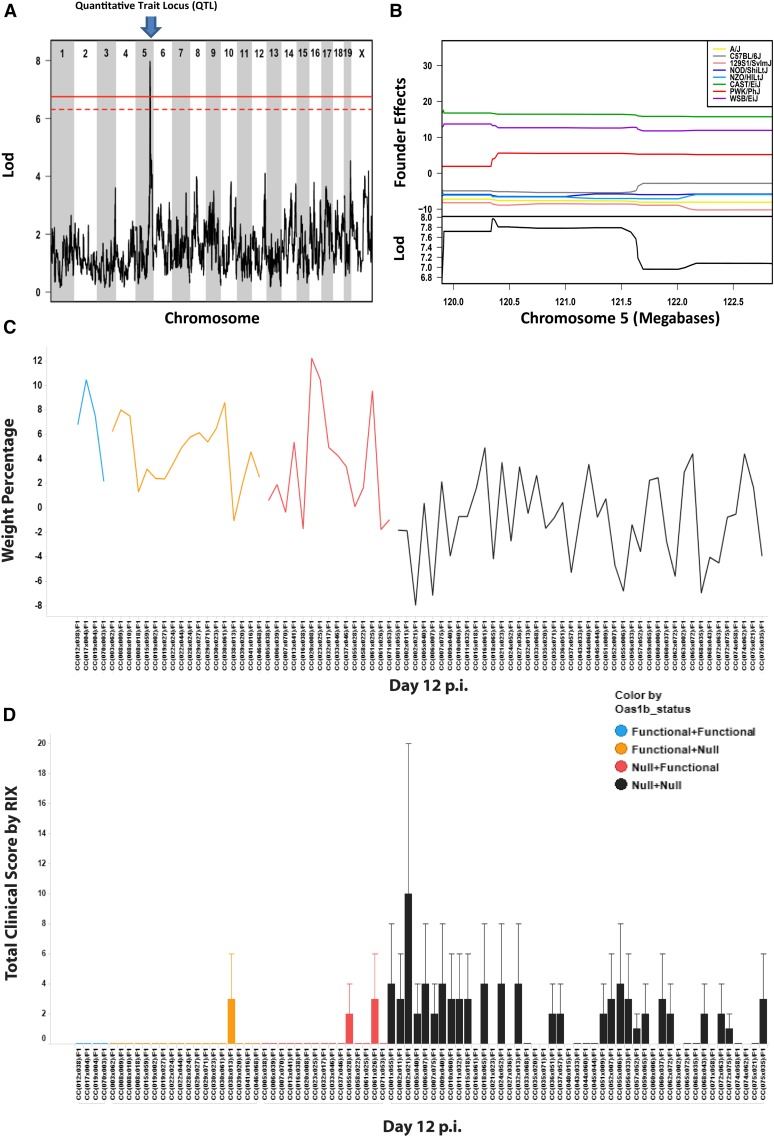
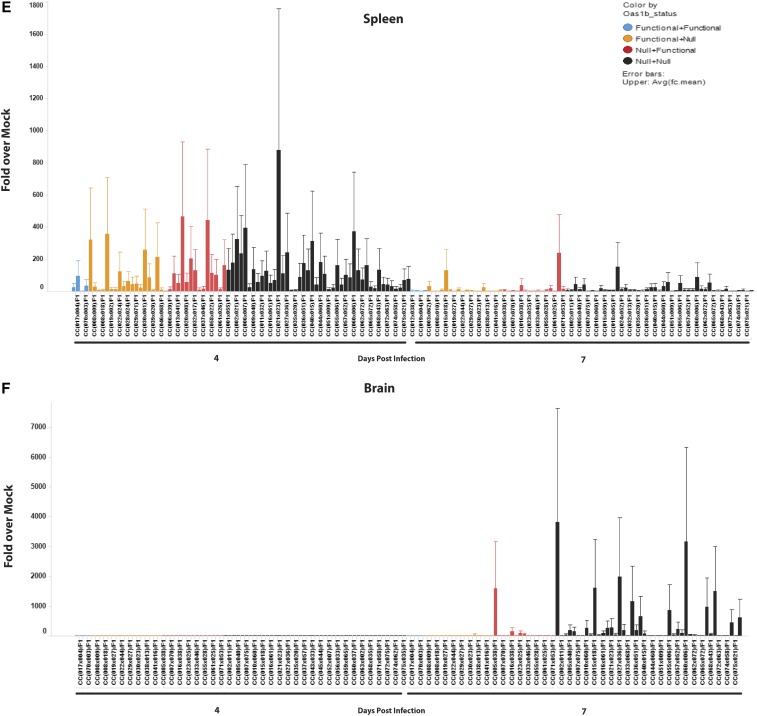
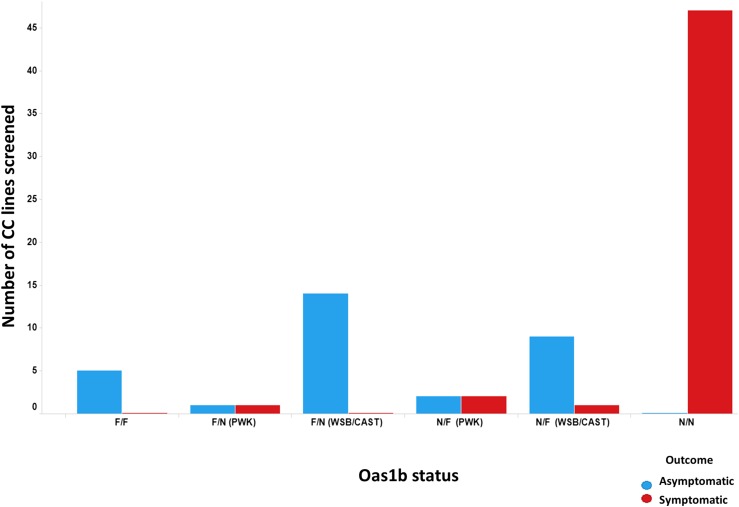
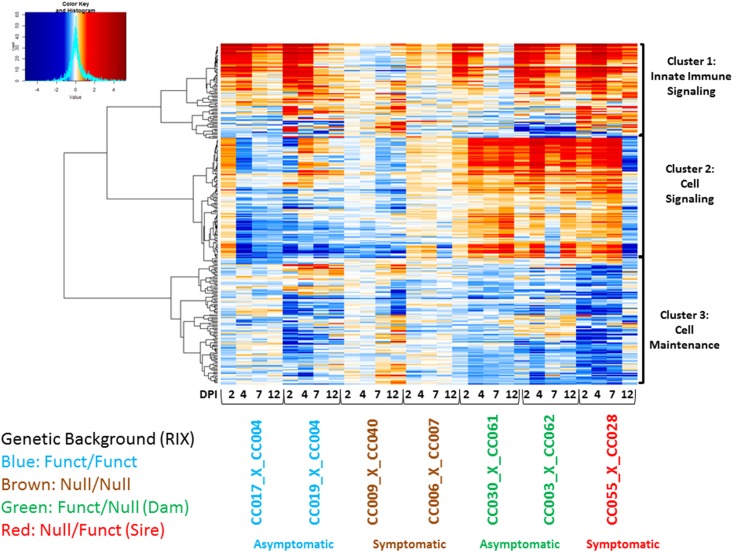
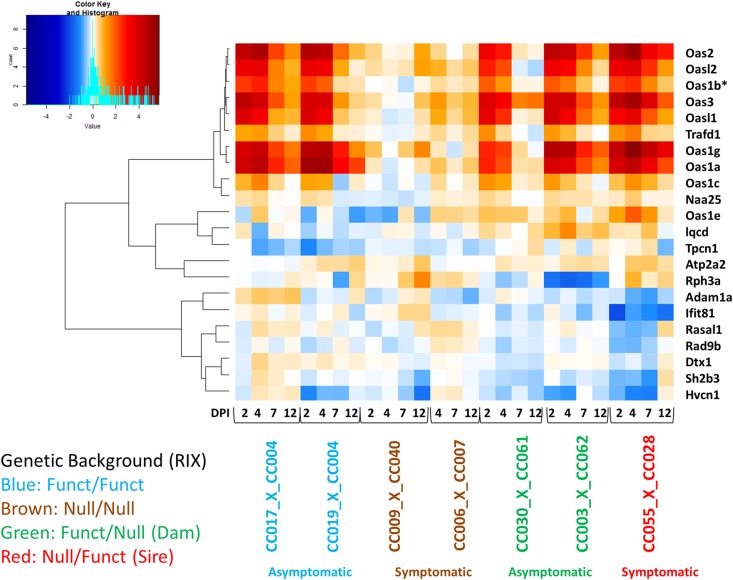
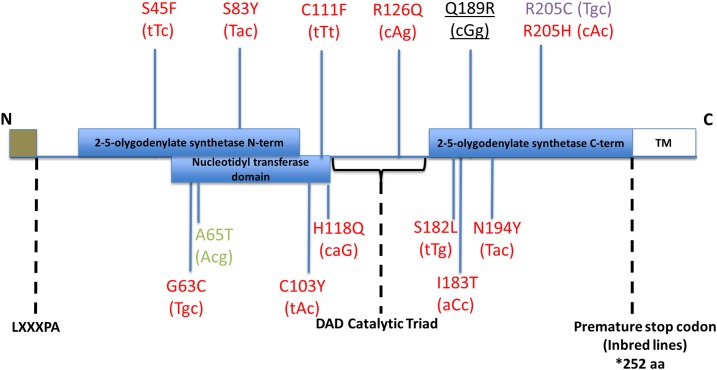
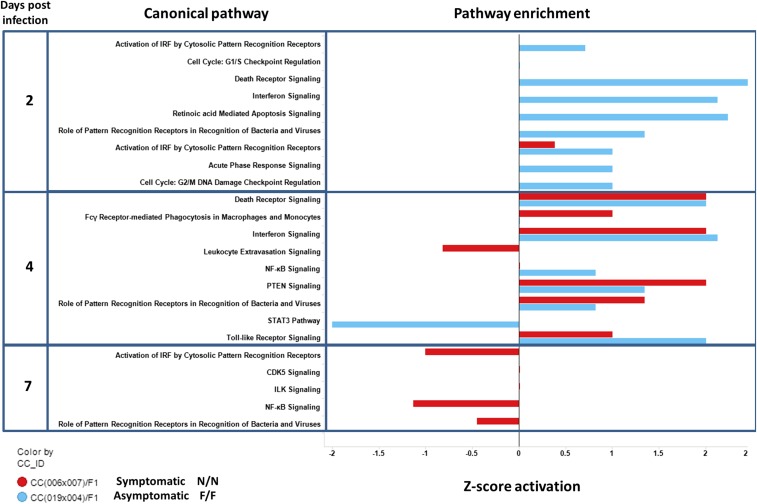
The oligoadenylate-synthetase (Oas) gene locus provides innate immune resistance to virus infection. In mouse models, variation in the Oas1b gene influences host susceptibility to flavivirus infection. However, the impact of Oas variation on overall innate immune programming and global gene expression among tissues and in different genetic backgrounds has not been defined. We examined how Oas1b acts in spleen and brain tissue to limit West Nile virus (WNV) susceptibility and disease across a range of genetic backgrounds. The laboratory founder strains of the mouse Collaborative Cross (CC) (A/J, C57BL/6J, 129S1/SvImJ, NOD/ShiLtJ, and NZO/HlLtJ) all encode a truncated, defective Oas1b, whereas the three wild-derived inbred founder strains (CAST/EiJ, PWK/PhJ, and WSB/EiJ) encode a full-length OAS1B protein. We assessed disease profiles and transcriptional signatures of F1 hybrids derived from these founder strains. F1 hybrids included wild-type Oas1b (F/F), homozygous null Oas1b (N/N), and heterozygous offspring of both parental combinations (F/N and N/F). These mice were challenged with WNV, and brain and spleen samples were harvested for global gene expression analysis. We found that the Oas1b haplotype played a role in WNV susceptibility and disease metrics, but the presence of a functional Oas1b allele in heterozygous offspring did not absolutely predict protection against disease. Our results indicate that Oas1b status as wild-type or truncated, and overall Oas1b gene dosage, link with novel innate immune gene signatures that impact specific biological pathways for the control of flavivirus infection and immunity through both Oas1b-dependent and independent processes.

Keywords: MPP; Multi-parent Advanced Generation Inter-Cross (MAGIC); Oas; flavivirus; innate immunity; multiparental populations; viral infection.


Figures

Figure 1
Figure 1
Analysis workflow. The analysis steps for generating innate immune regulatory networks and pathways influenced by Oas1b. qPCR, quantitative polymerase chain reaction; QTL, quantitative trait loci; RIX, recombinant inbred intercross; WNV, West Nile virus.
Figure 2
Figure 2
WNV QTL. (A) Genome scan of 90 F1s from day 12 weight loss with a significant QTL peak on chromosome 5. The top row indicates chromosome number and the y-axis is the LOD score. The LOD is the degree of concordance for a genetic marker for a phenotype (weight loss at day 12). The solid red line is p-value = 0.05 and the dotted line is p = 0.1. (B) The upper image is the contribution of each founder in the QTL (founder effects), where the population average is zero and each colored line represents a different founder’s predicted effect of one allelic copy on an individual’s phenotype (weight percentage at day 12). The lower image shows the LOD score in the lower y-axis. The x-axis shows the locus in megabases at chromosome 5. Each colored line represents a different founder’s predicted effect on phenotype. The positive alleles on the top show founder lines contributing to greater than the population mean, and the negative values contributing to less than the population mean. (C) Weight change at day 12 p.i. The y-axis represents weight percentage (gain or loss) across all RIXs. The x-axis shows the F1 identity and the color indicates Oas1b haplotype. Blue = F/F, orange = F/N, red = N/F, and black =N/N. (D) Total clinical score per F1 at day 12 p.i. Clinical score was determined as follows: 0, healthy mouse (baseline); 1, ruffled fur, lethargy, hunched posture, no paresis, and normal gait; 2, altered gait and limited movement in one hind limb; 3, lack of movement and paresis in one or both hind limbs. qPCR of WNV virus in the spleen (E) and brain (F) at days 4 and 7 p.i. The y-axis shows fold change over mock and the x-axis shows each F1 background and their days p.i. Each color represents Oas1b haplotype. Blue = F/F, Orange = F/N, Red = N/F, Black = N/N. LOD, log odds ratio; p.i., postinfection; qPCR, quantitative polymerase chain reaction; QTL, quantitative trait loci; RIX, recombinant inbred intercross; WNV, West Nile virus.
Figure 2
Figure 2
WNV QTL. (A) Genome scan of 90 F1s from day 12 weight loss with a significant QTL peak on chromosome 5. The top row indicates chromosome number and the y-axis is the LOD score. The LOD is the degree of concordance for a genetic marker for a phenotype (weight loss at day 12). The solid red line is p-value = 0.05 and the dotted line is p = 0.1. (B) The upper image is the contribution of each founder in the QTL (founder effects), where the population average is zero and each colored line represents a different founder’s predicted effect of one allelic copy on an individual’s phenotype (weight percentage at day 12). The lower image shows the LOD score in the lower y-axis. The x-axis shows the locus in megabases at chromosome 5. Each colored line represents a different founder’s predicted effect on phenotype. The positive alleles on the top show founder lines contributing to greater than the population mean, and the negative values contributing to less than the population mean. (C) Weight change at day 12 p.i. The y-axis represents weight percentage (gain or loss) across all RIXs. The x-axis shows the F1 identity and the color indicates Oas1b haplotype. Blue = F/F, orange = F/N, red = N/F, and black =N/N. (D) Total clinical score per F1 at day 12 p.i. Clinical score was determined as follows: 0, healthy mouse (baseline); 1, ruffled fur, lethargy, hunched posture, no paresis, and normal gait; 2, altered gait and limited movement in one hind limb; 3, lack of movement and paresis in one or both hind limbs. qPCR of WNV virus in the spleen (E) and brain (F) at days 4 and 7 p.i. The y-axis shows fold change over mock and the x-axis shows each F1 background and their days p.i. Each color represents Oas1b haplotype. Blue = F/F, Orange = F/N, Red = N/F, Black = N/N. LOD, log odds ratio; p.i., postinfection; qPCR, quantitative polymerase chain reaction; QTL, quantitative trait loci; RIX, recombinant inbred intercross; WNV, West Nile virus.
Figure 3
Figure 3
Disease outcome under Oas1b functionality. The number of F1s summarized by disease outcome. Outcome was determined as symptomatic (loss of 10% or greater body weight or succumbed to WNV infection) or asymptomatic (fought off infection and never lost 10% weight). Each group of mice is binned according to their Oas1b status. The heterozygous F1s are shown by their disease outcome and their allelic founder contribution. F/N(PWK) means the F1 contains at least one PWK allele (Null/PWK or PWK/Null). F/N(WSB/CAST) means the F1 contains at least one WSB/CAST allele. The colors indicate each’s F1’s outcome (blue = asymptomatic and red = symptomatic). CC, Collaborative Cross; WNV, West Nile virus.
Figure 4
Figure 4
Heatmap of immune disease modules. Coexpression in spleen at days 2, 4, 7, and 12 postinfection. The heatmap represents differential expression of 450 genes across seven F1s with different Oas1b functionality (F/F, N/N, F/N, and N/N). Expression is shown as log2(FC) WNV infected relative to mock. Red marks genes that are upregulated, blue for downregulated, and white represents no log2(FC). The y-axis shows genes that coregulate based on their directionality and magnitude. The x-axis shows the days postinfection, haplotype, and disease outcome according to the legend. Listed on the right as cluster 1: innate immunity, cluster 2: Cell maintenance, and cluster 3: cell signaling. log2(FC), log2 fold change; RIX, recombinant inbred intercross; WNV, West Nile virus.
Figure 5
Figure 5
Heatmap of QTL genes. Coexpression in spleen at days 2, 4, 7, and 12 postinfection. The heatmap represents differential expression of 21 genes found under the QTL across seven F1s with different Oas1b haplotype (F/F, N/N, F/N, and N/N). Expression is shown as log2(FC) WNV infected relative to mock. Red marks genes that are upregulated, blue for downregulated, and white represents no log2(FC). The y-axis shows genes that coregulate based on their directionality and magnitude. The x-axis shows the days postinfection, haplotype, and disease outcome according to the legend. log2(FC), log2 fold change; QTL, quantitative trait loci; RIX, recombinant inbred intercross; WNV, West Nile virus.
Figure 6
Figure 6
Oas1b protein. SNPs that impact aa sequence identified over annotated (Uniprot) functional domains. Changes in aa are coded relative to the reference sequence, which are identical for the five classical inbred founder strains, and changes are assigned to strains (PWK/PhJ = red; WSB/EiJ = purple; WSB/EiJ and Cast/EiJ = green; and PWK/PhJ, WSB/EiJ, and CAST/EiJ = underlined black). aa, amino acid; DAD (Motif); SNP, single nucleotide polymorphism; TM, transmembrane domain.
Figure 7
Figure 7
Pathway analysis in the presence (F/F, Functional + Functional Oas1b) and absence (N/N, Non-functional + Non-functional Oas1b) of functioning Oas1b. A bar plot quantifying enrichment of biological pathways across F1s and time points (2, 4, and 7 days) postinfection. The y-axis indicates time point and biological pathway. The x-axis shows the activation z-score for a pathway. The z-score is based on literature findings and determines the magnitude of gene regulation for a pathway. Values to the left indicate that pathway is inhibited and values to the right indicate that pathway is activated. The colors in the bar plot mark the different F1 backgrounds [blue = CC(009x040)F1 and red = CC(006x007)F1].
Figure 8
Figure 8
Pathway analysis in the heterozygous Oas1b F1s at day 2 and 4 post-WNV infection. A bar plot similar to day 4 showing enriched biological pathways. The y-axis indicates the haplotype, time point, and biological pathway. The x-axis shows the activation z-score for a pathway. Values to the left indicate that pathway is inhibited. Values to the right indicate that pathway is activated. The colors in the bar plot mark the different F1 backgrounds [blue = CC(003x062)F1 and black = CC(055x028)F1]. CC_ID, Collaborative Cross identifier.
Figure 9
Figure 9
Innate immune regulation network [Oas1b allele (F/F)]. Innate immune regulatory network identified in F1s with F/F Oas1b alleles. Each node represents a gene with different colored lines showing types of connectivity. Filled-in nodes are target genes from the dataset.
Figure 10
Figure 10
Innate immune regulation network [Oas1b allele (F/N)]. Innate immune regulatory network identified in F1s with F/N Oas1b alleles. Each node represents a gene with different colored lines showing types of connectivity. Filled-in nodes are target genes from the dataset.
Figure 11
Figure 11
Innate immune regulation network [Oas1b allele (N/N)]. Innate immune regulatory network identified in F1s with N/N Oas1b alleles. Each node represents a gene with different colored lines showing types of connectivity. Filled-in nodes are target genes from the dataset.
Figure 12
Figure 12
Infection regulator network F/F. A regulatory network generated from differentially expressed genes in CC(019x004)F1 at day 2 postinfection. The top nodes are transcriptional regulators. The red regulator was observed in the expression data and the orange nodes are predicted based on the target genes in our data set. The row of red-colored nodes indicate target genes that are upregulated. The lower orange and blue nodes refer to functional Gene Ontology (GO) terms. Antiviral response (GO:0050691) is predicted to be activated and replication of virus (GO:0019079) is predicted to be inhibited.

Similar articles

Cited by

References

    1. Bigham A. W., Buckingham K. J., Husain S., Emond M. J., Bofferding K. M., et al. , 2011. Host genetic risk factors for West Nile virus infection and disease progression. PLoS One 6(9): e24745. - PMC - PubMed
    1. Boon A. C., deBeauchamp J., Hollmann A., Luke J., Kotb M., et al. , 2009. Host genetic variation affects resistance to infection with a highly pathogenic H5N1 influenza A virus in mice. J. Virol. 83(20): 10417–10426. - PMC - PubMed
    1. Bottomly D., Wilmot B., McWeeney S. K. 2014. Oligomask: a framework for assessing and removing the effect of genetic variants on microarray probes. R J. 6(1): 159–163.
    1. Brinton M. A., Perelygin A. A., 2003. Genetic resistance to flaviviruses. Adv. Virus Res. 60: 43–85. - PubMed
    1. Cartmell T., Poole S., Turnbull A. V., Rothwell N. J., Luheshi G. N., 2000. Circulating interleukin-6 mediates the febrile response to localised inflammation in rats. J. Physiol. 526(Pt. 3): 653–661. - PMC - PubMed

Publication types

MeSH terms

Substances