. 2017 Jul 12;37(28):6761-6777.
doi: 10.1523/JNEUROSCI.2946-16.2017. Epub 2017 Jun 7.

Lower Affinity of Isradipine for L-Type Ca2+ Channels during Substantia Nigra Dopamine Neuron-Like Activity: Implications for Neuroprotection in Parkinson's Disease

Affiliations

Lower Affinity of Isradipine for L-Type Ca2+ Channels during Substantia Nigra Dopamine Neuron-Like Activity: Implications for Neuroprotection in Parkinson's Disease

Nadine J Ortner et al. J Neurosci. .

Abstract

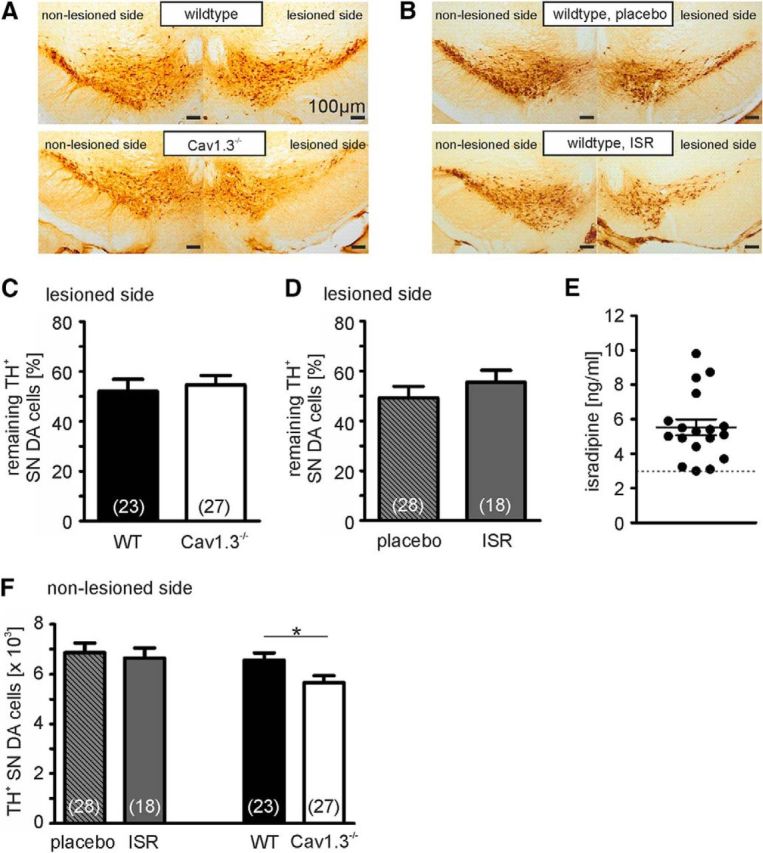
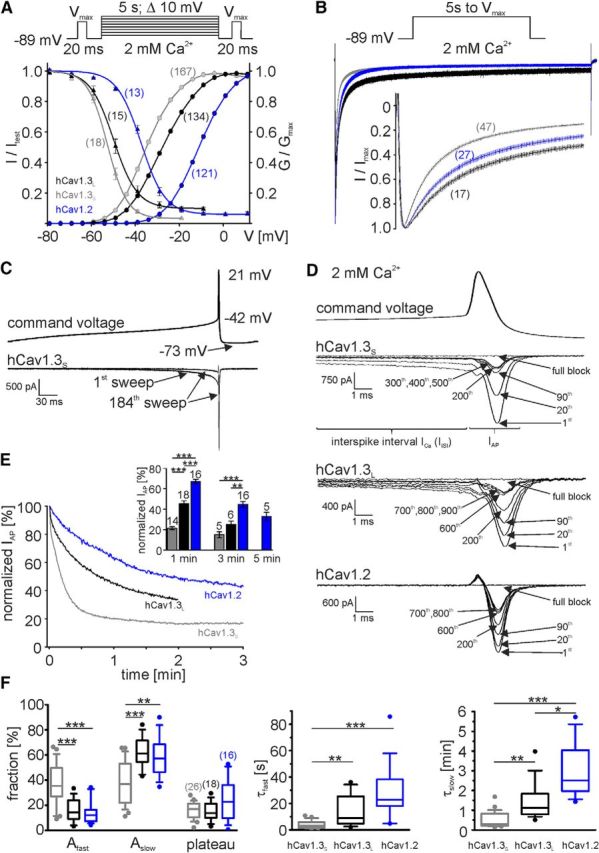
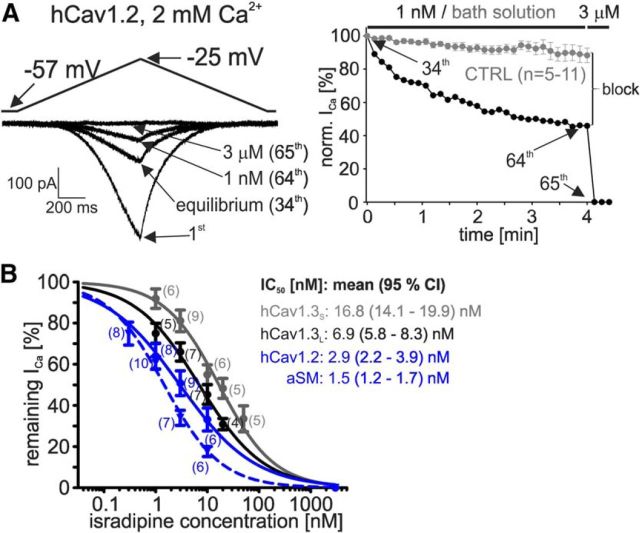
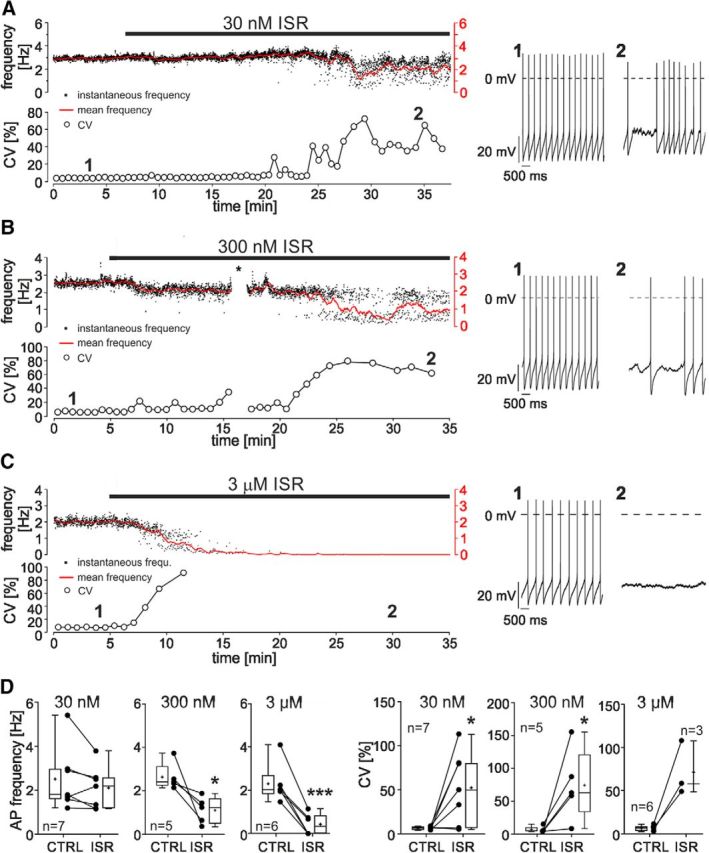
Ca2+-influx through L-type Ca2+-channels (LTCCs) is associated with activity-related stressful oscillations of Ca2+ levels within dopaminergic (DA) neurons in the substantia nigra (SN), which may contribute to their selective degeneration in Parkinson's disease (PD). LTCC blockers were neuroprotective in mouse neurotoxin models of PD, and isradipine is currently undergoing testing in a phase III clinical trial in early PD. We report no evidence for neuroprotection by in vivo pretreatment with therapeutically relevant isradipine plasma levels, or Cav1.3 LTCC deficiency in 6-OHDA-treated male mice. To explain this finding, we investigated the pharmacological properties of human LTCCs during SN DA-like and arterial smooth muscle (aSM)-like activity patterns using whole-cell patch-clamp recordings in HEK293 cells (Cav1.2 α1-subunit, long and short Cav1.3 α1-subunit splice variants; β3/α2δ1). During SN DA-like pacemaking, only Cav1.3 variants conducted Ca2+ current (ICa) at subthreshold potentials between action potentials. SN DA-like burst activity increased integrated ICa during (Cav1.2 plus Cav1.3) and after (Cav1.3) the burst. Isradipine inhibition was splice variant and isoform dependent, with a 5- to 11-fold lower sensitivity to Cav1.3 variants during SN DA-like pacemaking compared with Cav1.2 during aSM-like activity. Supratherapeutic isradipine concentrations reduced the pacemaker precision of adult mouse SN DA neurons but did not affect their somatic Ca2+ oscillations. Our data predict that Cav1.2 and Cav1.3 splice variants contribute differentially to Ca2+ load in SN DA neurons, with prominent Cav1.3-mediated ICa between action potentials and after bursts. The failure of therapeutically relevant isradipine levels to protect SN DA neurons can be explained by weaker state-dependent inhibition of SN DA LTCCs compared with aSM Cav1.2.SIGNIFICANCE STATEMENT The high vulnerability of dopamine (DA) neurons in the substantia nigra (SN) to neurodegenerative stressors causes Parkinson's disease (PD). Ca2+ influx through voltage-gated L-type Ca2+ channels (LTCCs), in particular Cav1.3, appears to contribute to this vulnerability, and the LTCC inhibitor isradipine is currently being tested as a neuroprotective agent for PD in a phase III clinical trial. However, in our study isradipine plasma concentrations approved for therapy were not neuroprotective in a PD mouse model. We provide an explanation for this observation by demonstrating that during SN DA-like neuronal activity LTCCs are less sensitive to isradipine than Cav1.2 LTCCs in resistance blood vessels (mediating dose-limiting vasodilating effects) and even at supratherapeutic concentrations isradipine fails to reduce somatic Ca2+ oscillations of SN DA neurons.

Keywords: L-type calcium channels; Parkinson's disease; calcium; isradipine; neuroprotection; pharmacology.


Figures

Figure 1.
Figure 1.
Evaluation of neuroprotective effects by Cav1.3 knockout or in vivo ISR pretreatment in a 6-OHDA PD mouse model (using male mice). A, B, Immunohistochemical stainings of TH+ SN DA neurons in rostral sections of wild-type and Cav1.3−/− mice (A) or wild-type mice (B) treated with ISR (6 or 9 mg/kg) or placebo 7 d before unilateral injection with 4.1 μg of 6-OHDA. Scale bars, 100 μm. C, D, The percentage of neurons remaining in the injected side compared with the noninjected side for each mouse were calculated 28 d after lesioning. Data are reported as the mean ± SEM. E, Distribution of ISR plasma levels in mice 35 d after pellet implantation with ISR plasma concentrations ≥3 ng/ml (mean ± SEM: 5.5 ± 0.5 ng/ml). F, A statistically significant difference for the absolute numbers of TH+ cells in the nonlesioned side was only observed between wild-type (WT) and Cav1.3−/− mice (wild-type mice: 6572 ± 285, n = 23; Cav1.3−/− mice: 5668 ± 282, n = 27; four independent experiments; p = 0.03; unpaired Student's t test) but not between ISR- or placebo-treated wild-type mice (ISR: 6655 ± 398, n = 18; placebo: 6861 ± 381, n = 29; four independent experiments). ***p < 0.001; **p < 0.01; *p < 0.05.
Figure 2.
Figure 2.
cDNA molecule number of Cav1.2 and Cav1.3 splice variants in individual laser-microdissected (LMD) SN DA neurons from juvenile and adult mice. A, Overview of coronal midbrain section of a juvenile mouse stained with cresyl violet after UV-LMD of 10 SN DA neurons. Bottom left, Image of a single SN DA neuron before UV-LMD. Bottom right, Gel electrophoresis of marker gene RT-PCR products using ∼30% of the cDNA as template. Note that only cDNA pools displaying the marker gene profile for SN DA neurons without contaminations (TH+; GFAP, CBd28k, and GAD65/67) were further analyzed by qRT-PCR. B, Verification of the striatal injection site of retrograde tracer (pink signal) for an adult mouse in a coronal TH-counterstained (green) and Nissl-counterstained (violet) section, aligned with the respective panel from the mouse brain atlas (Paxinos and Franklin, 2001). Bottom left, Image of a retrogradely traced adult mouse SN DA neuron before UV-LMD. Bottom right, Agarose gel electrophoresis of marker gene RT-PCR. C, Mean numbers of cDNA molecules of LTCC α1-subunits in single mouse SN DA neurons. Left, Comparison of Cav1.2 and Cav1.3 (all splice variants) expression in SN DA neurons from juvenile (P13) and adult (P90) mice. Right, Comparison of expression levels of major brain Cav1.3 splice variants in juvenile SN DA neurons. Cav1.3all: assay detects all Cav1.3 splice variants; Cav1.3L: assay specific for long Cav1.3L; Cav1.343S and Cav1.342A: assay detects the short Cav1.3 splice variants only (Bock et al., 2011; Huang et al., 2013). Cav1.342A corresponds to the short Cav1.3 construct used to generate the hCav1.3S stable cell line. Data are given as numbers of cDNA molecules/SN DA neuron determined via absolute DNA standard curves generated from dilution series of defined numbers of the respective PCR amplified and quantified target DNA molecules. Data are reported as the mean ± SEM (numbers of analyzed cDNA pools given in bars). Statistical significance was determined using the Mann–Whitney U test (C, left) or Kruskal–Wallis test (C, right; p = 0.0246) with Dunn's Multiple Comparison post hoc test. Outliers were identified using Grubbs' outlier test and excluded from analysis. ***p < 0.001; **p < 0.01; *p < 0.05.
Figure 3.
Figure 3.
Biophysical properties of the newly generated stable cell lines and time-dependent decrease of LTCC ICa during simulated regular SN DA-like pacemaking (2.5 Hz; 2 mm Ca2+). hCav1.2 (blue), hCav1.3S (gray), and hCav1.3L (black). A, Voltage dependence of activation and inactivation; normalized steady-state activation (circles) and inactivation (triangles) curves were obtained as described in Materials and Methods. Currents <200 and >3000 pA were prospectively excluded from analysis. For statistics see Table 1. B, Inactivation of stable cell lines during a 5-s-long depolarizing pulse from a holding potential of −89 mV to Vmax. Insets show the first 150 ms. Vertical lines represent error bars (mean ± SEM). For statistics see Table 1. C, AP waveform of an SN DA neuron used as command voltage to mimic regular pacemaking (top) and representative traces of the first (100%) and 184th (equilibrium) sweep of ICa through hCav1.3S (bottom). D, Representative current traces of hCav1.3S, hCav1.3L, and hCav1.2 are shown (with components insensitive to 3 μm ISR subtracted; for details, see Fig. 4A). All three LTCC isoforms conduct IAP. Only Cav1.3 channel constructs give rise to IISI. E, Time course of ICa decay of representative recordings for each LTCC subtype. IAP amplitude was normalized to the peak IAP amplitude of the first SN DA AP after holding the cell at −89 mV. At the end of each recording, LTCC ICa was completely blocked by 3 μm ISR and remaining ISR-insensitive current components were subtracted off-line. The inset shows mean values ±SEM (and n-numbers) of each construct after 1, 3, and 5 min of pacemaking. F, Curves were best described by a double-exponential function, and parameters are given as median (10th to 90th percentile; outliers illustrated as points). Statistical significance was determined using the Kruskal–Wallis test (Afast, Aslow, τfast, τslow: p < 0.0001) with Dunn's multiple-comparison post hoc test. ***p < 0.001; **p < 0.01; *p < 0.05.
Figure 4.
Figure 4.
ISR sensitivity of LTCC steady-state ICa during simulated SN DA neuron pacemaking (2.5 Hz, 2 mm Ca2+). A, Example for the inhibition of ICa through hCav1.3S channels using 20 nm ISR. The cell was depolarized using the SN DA neuron pacemaking protocol and was perfused with bath solution only. After reaching steady-state ICa (Fig. 3), ICa was inhibited with 20 nm ISR followed by complete inhibition with 3 μm ISR to quantify the remaining ISR-insensitive current components. This was subtracted from traces to obtain pure LTCC-mediated ICa (A, bottom trace) and to quantify IAP amplitudes. The outward current component occurring at the peak of the AP spike has also been shown in other publications (Patil et al., 1998; Helton et al., 2005; Marcantoni et al., 2010; Ortner et al., 2014) and was larger in recordings with large ON-gating currents (QON). Its amplitude was slightly reduced after complete LTCC block by 3 μm ISR but persisted together with an ISR-insensitive inward component. Both components were also observed in nontransfected HEK293 cells, which did not conduct any Ca2+ currents. It may therefore be composed of QON and a passive non-LTCC component. B, Right, The complete LTCC inhibition by 3 μm ISR was confirmed by a subsequent ramp protocol (−89 to +71 mV, 500 ms). Left: The I–V of the example cell before ISR application is shown for comparison. C, Representative experiments illustrating inhibition of ICa through hCav1.3L, hCav1.3S, or hCav1.2 using 3 nm ISR. Insets, Inhibition by ISR was corrected for linear current decay quantified during the perfusion of cells with bath solution only (CTRL shown in gray; mean ± SEM for all data points).
Figure 5.
Figure 5.
ISR sensitivity of hCav1.2 steady-state ICa during simulated aSM tone and ISR concentration–response curves for SN DA and aSM LTCCs (2 mm Ca2+). hCav1.2 (blue; SN DA, solid line; aSM, dashed line), hCav1.3S (gray), and hCav1.3L (black) are shown. A, aSM activity mimicked by voltage ramps. Starting from an HP of −89 mV, voltage was ramped from −57 to −25 mV and back to −57 mV at 32 mV/s and with an intersweep interval of 8 s at −57 mV. When ICa became stable (“equilibrium”), cells were perfused with vehicle (control, CTRL) or different concentrations of ISR and subsequently ICa was completely blocked by 3 μm ISR. Right, Normalized current of the same recording illustrating inhibition by 1 nm with time (1 pulse/8 s). Last sweep before drug application (34th sweep, “equilibrium,” left) was set to 100% and the percentage of inhibition was calculated after subtracting current decay in control cells (gray; mean ± SEM) from ISR effects. B, Concentration–response curves for LTCC steady-state ICa inhibition by ISR during simulated SN DA neuron pacemaking (hCav1.3, hCav1.2) and during aSM-like activity (hCav1.2). Data were fitted to a sigmoidal dose–response equation with variable slope (Hill slopes: hCav1.3S, −0.81 ± 0.06; hCav1.3L, −0.70 ± 0.06; hCav1.2, −0.60 ± 0.09; hCav1.2 aSM, −0.79 ± 0.06). Statistical significance was determined using the extra sum-of-squares F test (Hill slopes, p = 0.797; IC50 values, p < 0.0001). Significance level was set to p < 0.05.
Figure 6.
Figure 6.
Integrated ICa during and after a simulated SN DA neuron three spike burst (2 mm Ca2+) measured for hCav1.2 (blue), hCav1.3S (gray), and hCav1.3L (black). A, Cells were stimulated using a modeled 2.4 Hz pacemaker protocol. After ICa stabilization, regular pacemaking was followed by a three spike burst followed by a 1.5-s-long AHP (maximum, −82 mV). The last five APs preceding the burst (baseline) are shown. Representative ICa traces are given for each construct. Right, One single AP command voltage and IISI responses for all three LTCCs (outward signal and IAP were cutoff; again only the Cav1.3 constructs conducted IISI). B, C, The integrated ICa during a single AP (obtained as the mean of the five preceding APs) before the burst was set to 100% and compared with ICa during the three spike burst integrated over the time period equivalent to one AP (B) or the integrated ICa of the first or second AP after the AHP (C). Parameters are given as the median (10th to 90th percentile; outliers illustrated as points). The statistical significance between LTCC constructs was determined using one-way ANOVA (first AP, p < 0.0001; second AP, p = 0.0189; whole burst, p < 0.0001) with Bonferroni post hoc test: ***p < 0.001; **p < 0.01; *p < 0.05. Although the IAP amplitude of the first and second postburst AP was increased for all three LTCC constructs (data not shown), total Ca2+ influx (integrated ICa) was only significantly increased for Cav1.3 constructs (first AP: hCav1.3S, p = 0.0006; hCav1.3L, p = 0.0007; second AP: hCav1.3S, p = 0.0020; hCav1.3L, p = 0.0126; paired Student's t test). Integrated ICa through all three LTCCs was significantly higher during the burst (hCav1.3S, p < 0.0001; hCav1.3L, p = 0.0003; hCav1.2, p < 0.0001; paired Student's t test).
Figure 7.
Figure 7.
ISR effects on pacemaking in SN DA neurons recorded in adult mouse brain slices. A–C, Top, ISR effect on instantaneous AP frequency (black dots, calculated from current ISI), mean AP frequency (red line, bin width 30 s), and CV (from 100 ISI) before and during application of the indicated concentrations of ISR. Original traces from the recordings at the time points indicated by numbers are shown on the right. D, Summary box plots for spontaneous frequency and CV (mean of 2 min) under control conditions (CTRL) and 30 min after application of the indicated ISR concentrations (ISR). The number of neurons is given in the panels. After exposure to 3 μm ISR, three of six neurons stopped firing spontaneous APs and could not be included in the CV analysis. Statistical significance was determined using paired t test: ***p < 0.001; **p < 0.01; *p < 0.05. The asterisk in B shows a brief interruption of data acquisition.
Figure 8.
Figure 8.
ISR effects on pacemaking and AP-associated Ca2+ oscillations. A, Recording demonstrating the reversibility of pacemaking changes induced by 25 min perfusion with 300 nm ISR. Notice the different time scale of this recording compared with those in Figure 7. Original traces from the recordings shown above at the time points indicated by numbers are shown on the right. B, Neurons were recorded in the perforated patch-clamp configuration (top traces), while somatic Ca2+ oscillations were simultaneously imaged (bottom traces). Since AP-associated Ca2+ dynamics are strongly frequency dependent, the AP frequency was adjusted for Ca2+ imaging in all recorded neurons to a similar value of ∼1.5 Hz (mean ± SD, 1.48 ± 0.06 Hz; n = 20; five neurons, four time points in each neuron) by current clamp. The continuous recordings illustrate the AP firing and the associated somatic Ca2+ oscillations under control conditions (CTRL) and after 30 min of ISR application. The panels in between show the mean of 20 APs and the associated Ca2+ oscillations for the control (CTRL) and the indicated times after ISR application. Individual traces are superimposed in gray. They are barely visible for the APs due to small variability. C, Summary box plot showing the amplitude of Ca2+ oscillations 10, 20, and 30 min after the application of 30 nm ISR. Mean amplitudes of 20 oscillations were calculated and normalized to the amplitude at time 0 (CTRL). Data for five neurons are shown. No significant change by ISR exposure was observed (five neurons, one-sample t test).

References

    1. Akaike N, Harata N (1994) Nystatin perforated patch recording and its applications to analyses of intracellular mechanisms. Jpn J Physiol 44:433–473. 10.2170/jjphysiol.44.433 - DOI - PubMed
    1. Allen GS, Ahn HS, Preziosi TJ, Battye R, Boone SC, Boone SC, Chou SN, Kelly DL, Weir BK, Crabbe RA, Lavik PJ, Rosenbloom SB, Dorsey FC, Ingram CR, Mellits DE, Bertsch LA, Boisvert DP, Hundley MB, Johnson RK, Strom JA, et al. (1983) Cerebral arterial spasm–a controlled trial of nimodipine in patients with subarachnoid hemorrhage. N Engl J Med 308:619–624. 10.1056/NEJM198303173081103 - DOI - PubMed
    1. Amini B, Clark JW Jr, Canavier CC (1999) Calcium dynamics underlying pacemaker-like and burst firing oscillations in midbrain dopaminergic neurons: a computational study. J Neurophysiol 82:2249–2261. - PubMed
    1. Biel M, Hullin R, Freundner S, Singer D, Dascal N, Flockerzi V, Hofmann F (1991) Tissue-specific expression of high-voltage-activated dihydropyridine-sensitive L-type calcium channels. Eur J Biochem 200:81–88. 10.1111/j.1432-1033.1991.tb21051.x - DOI - PubMed
    1. Bock G, Gebhart M, Scharinger A, Jangsangthong W, Busquet P, Poggiani C, Sartori S, Mangoni ME, Sinnegger-Brauns MJ, Herzig S, Striessnig J, Koschak A (2011) Functional properties of a newly identified C-terminal splice variant of Cav1.3 L-type Ca2+ channels. J Biol Chem 286:42736–42748. 10.1074/jbc.M111.269951 - DOI - PMC - PubMed

Publication types

MeSH terms