. 2017 Jun 7;7(1):3000.
doi: 10.1038/s41598-017-02660-w.

Immune cell-derived cytokines contribute to obesity-related inflammation, fibrogenesis and metabolic deregulation in human adipose tissue

Affiliations

Immune cell-derived cytokines contribute to obesity-related inflammation, fibrogenesis and metabolic deregulation in human adipose tissue

Charles Caër et al. Sci Rep. .

Abstract

Adipose tissue contains a variety of immune cells, which vary in abundance and phenotype with obesity. The contribution of immune cell-derived factors to inflammatory, fibrotic and metabolic alterations in adipose tissue is not well established in human obesity. Human primary adipose tissue cells, including pre-adipocytes, endothelial cells and mature adipocytes, were used to investigate deregulation of cell- and pathway-specific gene profiles. Among factors known to alter adipose tissue biology, we focus on inflammatory (IL-1β and IL-17) and pro-fibrotic (TGF-β1) factors. rIL-1β and rIL-17 induced concordant pro-inflammatory transcriptional programs in pre-adipocytes and endothelial cells, with a markedly more potent effect of IL-1β than IL-17. None of these cytokines had significant effect on fibrogenesis-related gene expression, contrasting with rTGF-β1-induced up-regulation of extracellular matrix components and pro-fibrotic factors. In mature adipocytes, all three factors promoted down-regulation of genes functionally involved in lipid storage and release. IL-1β and IL-17 impacted adipocyte metabolic genes in relation with their respective pro-inflammatory capacity, while the effect of TGF-β1 occurred in face of an anti-inflammatory signature. These data revealed that IL-1β and IL-17 had virtually no effect on pro-fibrotic alterations but promote inflammation and metabolic dysfunction in human adipose tissue, with a prominent role for IL-1β.


Conflict of interest statement

The authors declare that they have no competing interests.

Figures

Figure 1
Figure 1
Obese omental adipose tissue microenvironment promotes IL-17 release. (A) IL-17+ and IL-22+ cells were quantified by FACS analysis of blood-derived memory CD4+ T cells cultured for 7 days without or with conditioned medium of omental adipose tissue (omCM) from lean (n = 3) or obese (n = 8) subjects. *P < 0.05. (B) IL-17 and IL-22 concentrations were determined by Luminex in blood-derived memory CD4+ T cells culture medium. *P < 0.05. (C) Correlation analysis between IL-17 concentration in blood CD4+ T cells culture medium and IL-1β concentration in omCM. The correlation coefficient (r) and p value were obtained by Spearman’s test. (D) IL17RA, IL22RA1 and IL1R1 mRNA were determined in pre-adipocytes (n = 7), CD31+ endothelial cells (n = 6) and adipocytes (n = 4) obtained from lipoaspirate adipose tissue samples. Data are shown as mean ± SEM. nd: not detected.
Figure 2
Figure 2
Pro-inflammatory signature in human adipose tissue non-immune cells. (A) CCL2, CCL20, IL-8, IL-6 and pro-IL-1β mRNA were determined by RT-qPCR in pre-adipocytes (n = 10) and CD31+ endothelial cells (n = 6) cultured for 96 h and by QuantiGene Plex in adipocytes 3D cultured for 72 h (n = 10) without or with rIL-17 (10 ng/mL) or rIL-1β (10 ng/mL). *P < 0.05 versus untreated cells. # P < 0.05 versus rIL-17 treated cells. (B) Concentrations of CCL2, CCL20, IL-8 and IL-6 were quantified by Luminex technology in culture media of pre-adipocytes (n = 6), CD31+ endothelial cells (n = 6) and adipocytes (n = 7) in untreated conditions (white bars) and in response to rIL-17 (stripped bars) or rIL-1β (black bars). *P < 0.05 versus untreated cells. #P < 0.05 versus rIL-17 treated cells. Data are shown as mean ± SEM.
Figure 3
Figure 3
Cytokine-specific effect on fibrotic and inflammatory genes. Principal components analysis (PCA) plots of fibrotic and inflammatory genes in pre-adipocytes (A) and CD31+ endothelial cells (B) treated or not by rIL-17 (10 ng/mL), rIL-1β (10 ng/mL) or rTGF-β1 (5 ng/mL). Points represent individual cell cultures in untreated control (Ctr) or cytokine-treated conditions as indicated. Groups are identified by color and circled with a median elliptical centroid. Arrows depict the contribution of each gene to sample coordinates. P values were obtained by Monte Carlo rank test.
Figure 4
Figure 4
Down-regulation of metabolic genes in primary human adipocytes. (A) Metabolic gene mRNA levels were analyzed by QuantiGene Plex in primary human adipocytes cultured in Puramatrix hydrogel for 72 h (n = 10) and treated or not by rIL-17 (10 ng/mL) or rIL-1β (10 ng/mL). *P < 0.05 versus untreated cells. # P < 0.05 versus rIL-17 treated cells. (B) Principal components analysis (PCA) plots of metabolic and inflammatory genes in adipocytes. Points represent individual adipocyte 3D culture in untreated control (Ctr) condition or in presence of rIL-17 (10 ng/mL), rIL-1β (10 ng/mL), rTGF-β1 (5 ng/mL) or CD45+ CM as indicated. Groups are identified by color and circled with a median elliptical centroid. Arrows depict the contribution of each gene to sample coordinates. P value was obtained by Monte Carlo rank test.
Figure 5
Figure 5
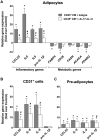
Cell-specific contribution of IL-1β and IL-17 to inflammatory and metabolic gene regulation. (A) Metabolic and inflammatory genes were quantified by QuantiGene Plex in adipocytes (n = 4). Inflammatory gene levels were analyzed by RT-qPCR in (B) CD31+ endothelial cells (n = 6) and (C) pre-adipocytes (n = 6). Cells were cultured in presence of CD45+ cells conditioned medium (CD45+ CM), with addition of isotype control (grey bars) or anti-IL-17 (αIL-17) and anti-IL-1β (αIL-1β) neutralizing (white bars) antibodies. *P < 0.05 versus untreated cells. # P < 0.05 versus CD45+ CM + isotype treated cells. Data are shown as mean ± SEM.

References

    1. DiSpirito JR, Mathis D. Immunological contributions to adipose tissue homeostasis. Semin Immunol. 2015;27:315–21. doi: 10.1016/j.smim.2015.10.005. - DOI - PMC - PubMed
    1. Morris DL, Singer K, Lumeng CN. Adipose tissue macrophages: phenotypic plasticity and diversity in lean and obese states. Curr Opin Clin Nutr Metab Care. 2011;14:341–6. doi: 10.1097/MCO.0b013e328347970b. - DOI - PMC - PubMed
    1. Chawla A, Nguyen KD, Goh YP. Macrophage-mediated inflammation in metabolic disease. Nat Rev Immunol. 2011;11:738–49. doi: 10.1038/nri3071. - DOI - PMC - PubMed
    1. Dalmas E, Clement K, Guerre-Millo M. Defining macrophage phenotype and function in adipose tissue. Trends Immunol. 2011;32:307–14. doi: 10.1016/j.it.2011.04.008. - DOI - PubMed
    1. Kratz M, et al. Metabolic dysfunction drives a mechanistically distinct proinflammatory phenotype in adipose tissue macrophages. Cell Metab. 2014;20:614–25. doi: 10.1016/j.cmet.2014.08.010. - DOI - PMC - PubMed

Publication types