. 2017 Jun 7;7(1):3005.
doi: 10.1038/s41598-017-03494-2.

Activity-independent targeting of mTOR to lysosomes in primary osteoclasts

Affiliations

Activity-independent targeting of mTOR to lysosomes in primary osteoclasts

Andrew Wang et al. Sci Rep. .

Abstract

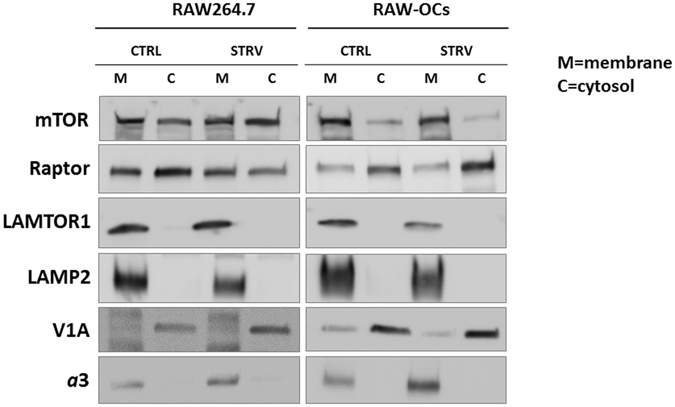
Mammalian target of rapamycin (mTOR) is activated by numerous stimuli, including amino acids and growth factors. This kinase is part of the mTOR complex 1 (mTORC1) which regulates cell proliferation, differentiation, and autophagy. Active mTORC1 is located on lysosomes and has been reported to disassociate from the lysosomal surface in the absence of amino acids. Furthermore, mTORC1 activity has been linked to the vacuolar H+-ATPases (V-ATPases), the proton pumps responsible for lysosomal acidification; however, the exact role of the V-ATPases in mTORC1 signaling is not known. To elucidate the mechanisms involved in mTORC1 regulation by the V-ATPases, we used primary osteoclasts derived from mice carrying a point (R740S) mutation in the a3 subunit of the V-ATPase. In these cells, the mutant protein is expressed but the pump is not functional, resulting in higher lysosomal pH. By analyzing mTOR activation, mTOR/lysosome co-localization, and lysosomal positioning using confocal microscopy, fractionation, and ultrapure lysosomal purification methods, we demonstrate that in primary osteoclasts, mTOR is localized on the lysosomal surface even when mTOR activity is inhibited. Our findings reveal that mTOR targeting to the lysosome in osteoclasts is activity-independent, and that its disassociation from the lysosome during starvation is not universal.


Conflict of interest statement

The authors declare that they have no competing interests.

Figures

Figure 1
Figure 1
mTORC1 activity is increased in R740S/R740S cells. Spleen-derived osteoclasts were differentiated as described in “Materials and Methods”. On day 4 of culture, the cells were incubated with HBSS (starvation) for 60 min, and then in fully supplemented media for additional 30 min. (A) Immunofluorescence. Cells were fixed and stained with an anti-a3 antibody as described in “Materials and Methods”; nuclei were stained with DAPI. Representative images of three independent experiments. Bars, 15 μm. (B) Immunoblotting, representative cropped blots of 4 independent experiments. Whole cell lysates were separated on 4–20% gradient gels, transferred to a nitrocellulose membrane and probed for mTOR, p-mTOR, p-AKT, pan-AKT, p-p70S6K, and actin. (C) Quantification of immunoblots; combined normalized data of at least 4 independent experiments, mean ± std. dev; * indicates statistical significance compared to +/+ control, # indicates statistical significance compared to +/R740S control, p < 0.05.
Figure 2
Figure 2
Autophagy is inhibited in osteoclasts with R740S mutation. Spleen-derived osteoclasts were differentiated as described in “Materials and Methods”. (A) Immunoblotting, representative cropped blots of 4 independent experiments. On day 4 of culture, the cells were incubated with HBSS (starvation) for 60 min, and then in fully supplemented media for additional 30 min. Whole cell lysates were separated on 4–20% gradient gels, transferred to a nitrocellulose membrane and probed for LC3, p62 and actin. (B) Quantification of immunoblots; combined normalized data of 4 independent experiments, mean ± std. dev; * indicates statistical significance compared to +/+ control, p < 0.05. (C) LC3 immunostaining. Spleen-derived osteoclasts were treated as described in (A), fixed, stained with anti-LC3B antibody as described in “Materials and Methods”; nuclei were stained with DAPI. Representative images. Bars, 17 μm.
Figure 3
Figure 3
mTOR/LAMP2 co-localization in osteoclasts does not change in response to amino acid availability. Spleen-derived osteoclasts were differentiated as described in “Materials and Methods”. On day 4 of culture, the cells were incubated with HBSS (starvation) for 60 min and then with fully supplemented media for 30 min. (A) Cells were fixed and stained using anti-mTOR and anti-LAMP2 antibodies. Representative confocal images; nuclei were stained with DAPI; bars 15 µm. (B) Custom macro peripheral depth analysis mask showing depth/sliver distribution. (C) Quantification of mTOR and LAMP2 distribution, mTOR/LAMP2 co-localization at the periphery, Pearson’s correlation coefficient; mean ± SEM, * indicates statistical significance compared to +/+ control, p < 0.05. (D) Total cell Pearson’s correlation coefficient; mean ± SEM. The number of cells used for quantification is as follows: +/+ CTRL n = 38; +/+ STRV n = 39; +/+ REC n = 47; +/R740S CTRL n = 33; +/R740S STRV n = 27; +/R740S REC n = 34; R740S/R740S CTRL n = 44; R740S/R740S STRV n = 43; R740S/R740S REC n = 45).
Figure 4
Figure 4
Microtubular organization in osteoclasts. Cells were cultured as described in “Materials and Methods” and stained using anti-α-tubulin antibody; nuclei were stained with DAPI. STRV = starvation, HBSS, 1 hr. Representative images of three independent experiments; bars 20 µm.
Figure 5
Figure 5
mTOR is primarily membrane-associated in osteoclasts. RAW264.7 cells and RAW-derived osteoclasts (RAW-OCs) were cultured and cytosolic and membrane fractions were prepared as described in “Materials and Methods”. Equal protein amounts were separated on 4–20% gradient gels, transferred to a nitrocellulose membrane and probed for mTOR, Raptor, LAMTOR1, LAMP2, a3, and V1A. Representative cropped blots of 4 independent experiments. M = membrane fraction; C = cytosolic fraction; CTRL = control, no treatment; STRV = starvation, HBSS, 1 hr.
Figure 6
Figure 6
mTOR remains associated with the lysosomes in osteoclasts during amino acid starvation. (A) RAW264.7-derived osteoclasts (RAW-OCs) were differentiated for 4 days, incubated with dextran coated magnetic nanobeads for 24 hrs, chased for additional 24 hrs, and lysosomes purified as described in “Materials and Methods”. (B) Purified lysosomes from the undifferentiated RAW264.7 cells were isolated as described in “Materials and Methods”. Equal amounts of protein were loaded per lane and the blots were probed for mTOR, p-mTOR, Raptor, LAMTOR1, LAMP2, and the V-ATPase subunits a3 and A. Representative cropped blots of three independent experiments for RAW-OCs and for undifferentiated RAW264.7 cells. CTRL = control, no treatment; STRV = starvation, HBSS, 1 hr.

References

    1. Betz C, Hall MN. Where is mTOR and what is it doing there? The Journal of cell biology. 2013;203:563–574. doi: 10.1083/jcb.201306041. - DOI - PMC - PubMed
    1. Perl A. Activation of mTOR (mechanistic target of rapamycin) in rheumatic diseases. Nature reviews. Rheumatology. 2016;12:169–182. doi: 10.1038/nrrheum.2015.172. - DOI - PMC - PubMed
    1. Efeyan A, Zoncu R, Sabatini DM. Amino acids and mTORC1: from lysosomes to disease. Trends Mol Med. 2012;18:524–533. doi: 10.1016/j.molmed.2012.05.007. - DOI - PMC - PubMed
    1. Zoncu R, et al. mTORC1 senses lysosomal amino acids through an inside-out mechanism that requires the vacuolar H(+)-ATPase. Science. 2011;334:678–683. doi: 10.1126/science.1207056. - DOI - PMC - PubMed
    1. Korolchuk VI, et al. Lysosomal positioning coordinates cellular nutrient responses. Nature cell biology. 2011;13:453–460. doi: 10.1038/ncb2204. - DOI - PMC - PubMed

Publication types

Substances

Grants and funding