. 2017 Jun 7;7(1):3017.
doi: 10.1038/s41598-017-02954-z.

High-precision spatial localization of mouse vocalizations during social interaction

Affiliations

High-precision spatial localization of mouse vocalizations during social interaction

Jesse J Heckman et al. Sci Rep. .

Abstract

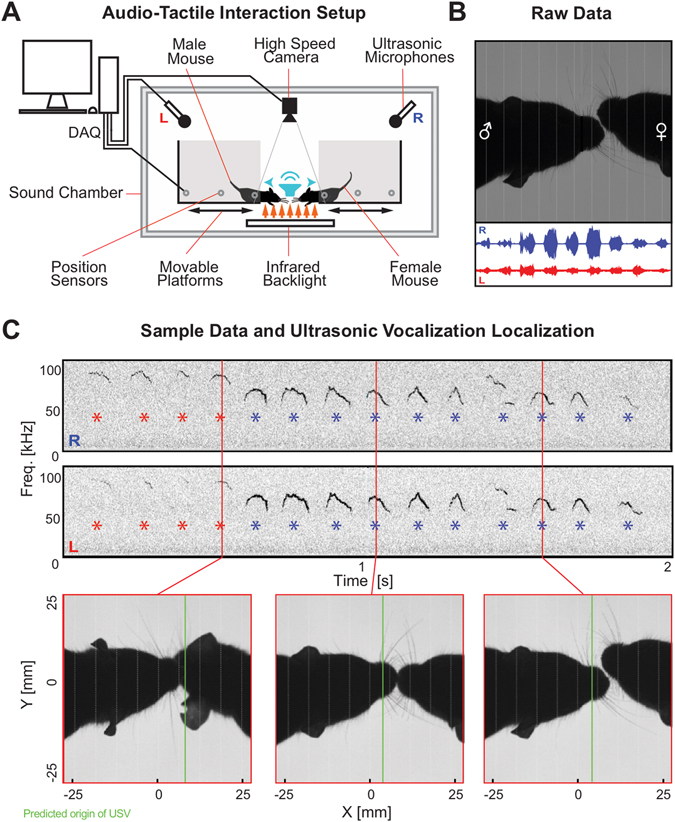
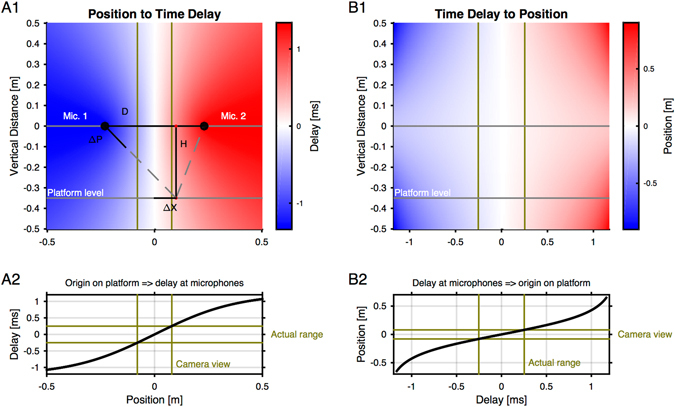
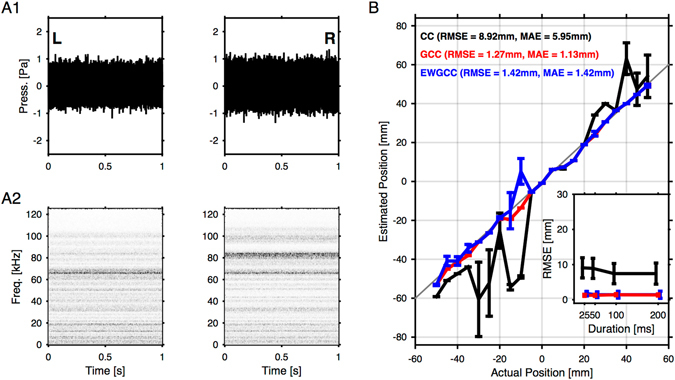
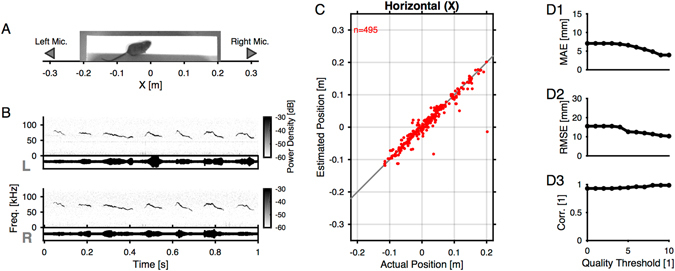
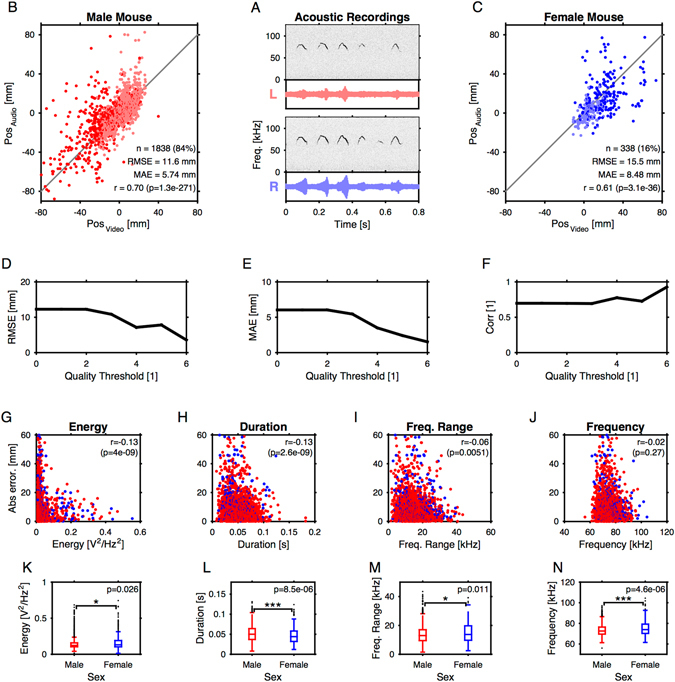
Mice display a wide repertoire of vocalizations that varies with age, sex, and context. Especially during courtship, mice emit ultrasonic vocalizations (USVs) of high complexity, whose detailed structure is poorly understood. As animals of both sexes vocalize, the study of social vocalizations requires attributing single USVs to individuals. The state-of-the-art in sound localization for USVs allows spatial localization at centimeter resolution, however, animals interact at closer ranges, involving tactile, snout-snout exploration. Hence, improved algorithms are required to reliably assign USVs. We develop multiple solutions to USV localization, and derive an analytical solution for arbitrary vertical microphone positions. The algorithms are compared on wideband acoustic noise and single mouse vocalizations, and applied to social interactions with optically tracked mouse positions. A novel, (frequency) envelope weighted generalised cross-correlation outperforms classical cross-correlation techniques. It achieves a median error of ~1.4 mm for noise and ~4-8.5 mm for vocalizations. Using this algorithms in combination with a level criterion, we can improve the assignment for interacting mice. We report significant differences in mean USV properties between CBA mice of different sexes during social interaction. Hence, the improved USV attribution to individuals lays the basis for a deeper understanding of social vocalizations, in particular sequences of USVs.


Conflict of interest statement

The authors declare that they have no competing interests.

Figures

Figure 1
Figure 1
The study of mouse vocalizations during natural behavior requires attributing individual vocalizations to individual mice. (A) For development and testing of localization algorithms a dedicated interaction space was designed. Mouse vocalizations were recorded during social interactions of a male-female pair of CBA mice. Mice were located on separated platforms, which allowed them to interact by making snout contact, but not cross the platforms. The entire setup was housed in a sound attenuated chamber. For testing and calibration of the algorithms, localization performance was in addition assessed using a movable speaker, which was positioned at a set of locations that could reflect mouse positions (indicated by the blue speaker). For detailed spatial dimensions of the setup, see Methods. (B) Positions were estimated based on high-speed video-images captured from directly above (upper part), and also based on mouse vocalizations recorded at two locations above the platforms (lower part; channels are represented in blue and red). (C) Mice vocalised primarily during social interaction, where they are in close proximity. Attribution of vocalizations is complicated by the partial overlap of the snouts.
Figure 2
Figure 2
Analytical solution to account for the dependence of inter-microphone delay on microphone elevation. (A1) The position of a sound source relative to the microphones determines the difference in their sound arrival times (negative values indicate arrival at Mic. 1 before Mic. 2, computed using Eq. 6. The variables are indicated to visualize the computation. ΔP = Path difference from sound source to the two microphones; ΔX = Position sound source relative to the center; H = Microphone height relative to the platform; D = Distance between the microphones). Since the microphones are typically not positioned at the same height as the animal snouts, this difference in arrival times depends on the horizontal position and the relative height between snouts and microphones (colour coded here for all potential sound source positions). (A2) As a function of horizontal position, the dependence is sigmoidal, centered between the microphones and a slope which depends on the microphone height. Depicted here is the position-to-time relation for the dimensions of the present setup (microphone height: 356 mm). The inter-microphone delay ranges roughly between [−1,1] ms, i.e. less than maximally possible ([−1.25,1.25] ms), if the microphones were on the same height as the platform. In the camera’s view field (between vertical green), the dependence is close to linear. This leads to the relevant range of delays which can be compared to camera positions. (B1) To obtain the sound source position from the inter-microphone delay, the position-delay relationship has to be inverted. We computed this analytically (see Eq. 12), which leads to hyperbolic-type shapes for a given platform level. (B2) For the present setup, the position as a function of inter-microphone delay is relatively flat, and very close to linear in the region of the camera view. The formulas allow a computation of the horizontal position from the inter-microphone measurement.
Figure 3
Figure 3
Ground truth comparison for artificial broadband sounds. The accuracy of the different estimation algorithms was compared on the basis of artificial sounds (Gaussian noise), which were presented using a movable speaker at a range of locations, i.e. −50 mm to 50 mm at 5 mm steps (see Figs 1 and S2 for setup/speaker details). (A) The recorded sound at the left (A1, left) and the right (A1, right) microphone were similar in level, but differed in frequency content (compare spectrograms in A2 left with A2 right). Since the speaker was well equalised (see Fig. S1), these spectral differences must stem from reflections inside the apparatus In addition, they also depended on the speaker location (not shown). (B) The localization methods were evaluated across the entire range. The generalised cross correlation (GCC, red) method performed best, with a median residual RMSE = 1.27 mm (MAE = 1.13 mm). In comparison, the basic cross-correlation (CC, black) diverged erratically outside the central range of positions, leading to a substantially greater median RMSE = 8.92 mm mm (MAE = 5.95 mm). The envelope weighted generalised crosscorrelation (EWGCC, blue) performed almost as well as GCC with an RMSE = 1.42 mm (MAE = 1.42 mm). Results show averages over 10 random draws, and error bars represent 1 SEM. The quality of localization showed only a slight dependence on available data, reaching precise localization already for segments of 25 ms duration (inset). The errorbars in the inset show [14,86]% percentiles, i.e. indicate the level of variability of these estimates.
Figure 4
Figure 4
Localization of USVs from a single mouse. (A) Schematic of the recording setup and sample image. The mouse was free to move on the platform, and was repetitively brought into snout-snout contact with a female mouse ~30 s after the last vocalization. The female mouse was placed into a sound proofed box immediately after to primarily record male vocalizations. The platform was padded with acoustic foam and a very soft cloth to reduce movement noise. (B) The vocalizations emitted by the male mice under this condition resembled the vocalizations observed during social interaction in the gap interaction setup. The shapes of the USVs are well conserved across the two microphones (top: left, bottom: right), while the amplitude of the vocalizations differs naturally based on the direction of vocalization. (C) The actual vs. estimated positions corresponded well with each other (n = 3 mice). The depicted data is shown for correlation quality measures (CQM) > 6 (see Methods). The few outliers may be a due to environmental noise, as they also exhibited clear correlation peaks. (D) Estimation quality was assessed via the median average error (MAE, D1), the root mean squared error (RMSE, D2) and the correlation (Spearman rank correlation, D3). The precision of the estimates improved with CQM, where results are displayed as a function of quality threshold (i.e. for USVs with CQM greater or equal). MAE converged to ~4 mm, MSE to about 10 mm, and correlation reach values above 0.99.
Figure 5
Figure 5
Properties of vocalizations during snout-snout interaction. (A) Acoustic recordings of mouse vocalizations were collected with two microphones (Top, left (red) microphone; bottom: right (blue) microphone). While the level of each vocalization varied between the microphones, the spectrotemporal structure remains well resolved in both. (B) The majority of the vocalizations were attributed to the male mouse (~84%), either based on location along (dark red) or based on a combination of position and relative level at the two microphones (light red, for cases where the mouse snouts were within 10 mm of each other). The actual location of the mouse head, estimated from the video (abscissa) was well predicted by the audio-based estimate (ordinate). (C) A smaller number of vocalizations was attributed to the female mouse (~16%). The estimated locations also agree well with the actual position of the female mouse exhibiting a solid correlation. (D–F) If vocalization were selected based on different CQM thresholds, the localization quality improved as measured by RMSE (D), MAE (E) and Spearman correlation (F). (G–J) The quality of localization dependent significantly on a USV’s energy (G), duration (H), and frequency range (I), however, was not significantly correlated with mean frequency itself (J). (K–N) The properties of vocalization differed between the sexes. Male calls had significantly lower mean frequency (Wilcoxon rank sum test, p ≪ 0.001; J) and longer durations (Wilcoxon rank sum test, p ≪ 0.001; H) than females calls, while energy (G) and frequency range (I) exhibited borderline significances (p < 0.05).
Figure 6
Figure 6
Sex differences in motor cortical projections in the mouse brain. Monosynaptic projections originating from a motor cortical region of interest (ROI) were quantified as described in the Materials and Methods section. (A) Major projection targets for the infragranular neurons in the ROI. The edge weight represents the relative weight of projections by volume. Only the top 13 targets are shown. (B) Normalised projection density across all nodes in the mouse brain. Downward triangles mark those nodes that receive monosynaptic input exclusively in the female brain. The numbers associated with triangle refer to the name of nuclei which are listed below the figure. (C) The difference of the normalised energy values across the sexes reveal the nodes that receive preferential input from either sex. Nodes marked with IIX and IX refer to descending nuclei that have preferential M1/M2 input in the female brain, compared to the male. Nodes, X-XIIV are nuclei that have preferential input in the male mouse brain.

Similar articles

Cited by

References

    1. Grimsley JMS, Monaghan JJM, Wenstrup JJ. Development of social vocalizations in mice. PLoS ONE. 2011;6:e17460. doi: 10.1371/journal.pone.0017460. - DOI - PMC - PubMed
    1. Neilans EG, Holfoth DP, Radziwon KE, Portfors CV, Dent ML. Discrimination of ultrasonic vocalizations by CBA/CaJ mice (Mus musculus) is related to spectrotemporal dissimilarity of vocalizations. PLoS ONE. 2014;9:e85405. doi: 10.1371/journal.pone.0085405. - DOI - PMC - PubMed
    1. Liu RC, Miller KD, Merzenich MM, Schreiner CE. Acoustic variability and distinguishability among mouse ultrasound vocalizations. J Acoust Soc Am. 2003;114:3412–3422. doi: 10.1121/1.1623787. - DOI - PubMed
    1. Holy TE, Guo Z. Ultrasonic songs of male mice. PLoS Biol. 2005;3:e386. doi: 10.1371/journal.pbio.0030386. - DOI - PMC - PubMed
    1. Heckman J, McGuinness B, Celikel T, Englitz B. Determinants of the mouse ultrasonic vocal structure and repertoire. Neurosci Biobehav Rev. 2016;65:313–325. doi: 10.1016/j.neubiorev.2016.03.029. - DOI - PubMed

Publication types