. 2017 Jun 7;7(1):2975.
doi: 10.1038/s41598-017-02926-3.

Formation Mechanism for 2015/16 Super El Niño

Affiliations

Formation Mechanism for 2015/16 Super El Niño

Lin Chen et al. Sci Rep. .

Abstract

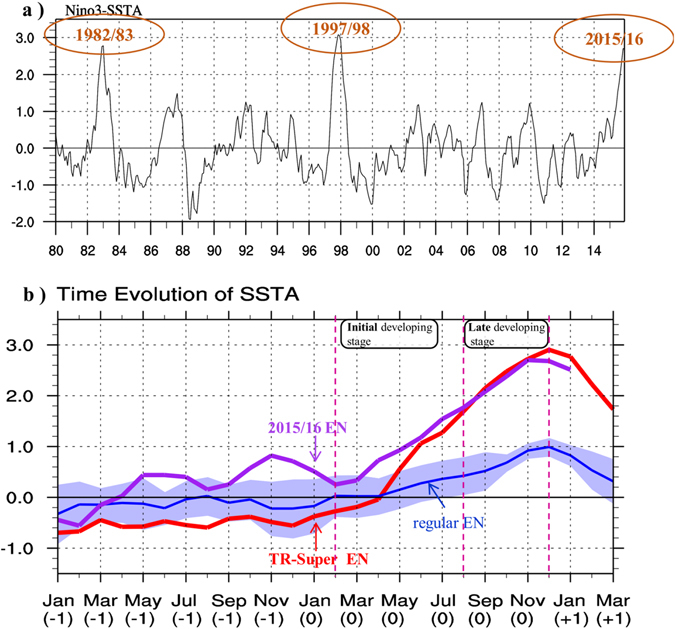
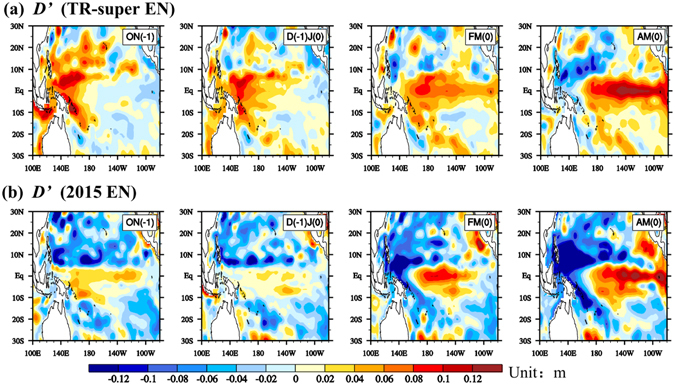
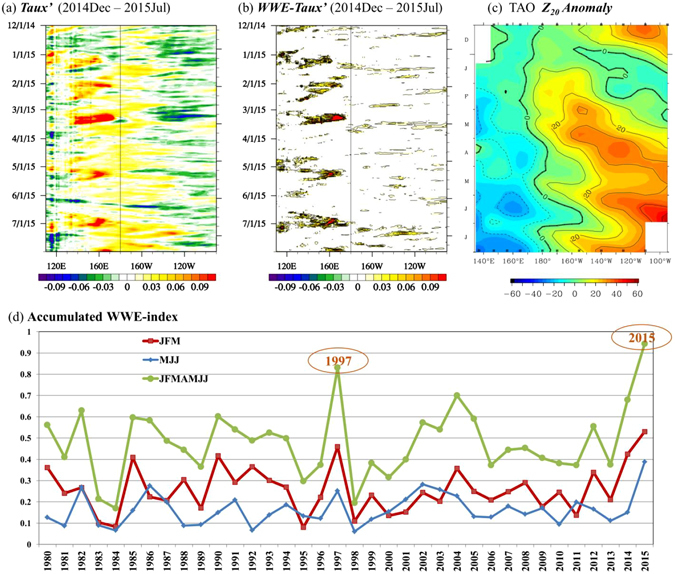
The extreme El Niño (EN) events in 1997/98 and 1982/83, referred to as super EN, exerted remarkable global influence. A super EN was anticipated on the way in early 2014 but failed to materialize toward the end of 2014. Whilst the scientific community was still puzzling about the cause of the aborted EN event in 2014, the remnants of the decaying warming in late 2014 unexpectedly reignited since February 2015 and grew into a super EN by the end of 2015. Understanding the onset mechanism of the 2015 EN event and its differences from past super EN events is crucial for improving EN prediction in a changing climate. Our observational analyses and modeling studies demonstrate that the principal difference between the 2015 EN and the past super ENs lies in exceptionally strong and consecutive occurrence of westerly wind burst events that turned around unfavorable ocean thermocline conditions in tropical western Pacific in early 2015, reigniting rapidly the surface warming in the eastern Pacific. By August the sea surface temperature anomalies reached a critical amplitude similar to that of the past super ENs; positive atmosphere-ocean feedbacks further amplify this warm episode into a super EN by the end of 2015.


Conflict of interest statement

The authors declare that they have no competing interests.

Figures

Figure 1
Figure 1
(a) Time series of the sea surface temperature anomaly (SSTA) averaged over Niño3 (i.e., Niño3 index) from ERSST. Here Niño3 region is bounded by 5°S-5°N and 150°W-90°W. (b) Temporal evolution of Niño3 SSTA. Purple line indicates the 2015/16 El Niño (i.e., 2015EN), red line indicates the composite of traditional super EN events (i.e., 1982/83 EN and 1997/98 EN), and the blue line indicates the composite of the regular EN events during 1980–2015 (including 1986/87, 1987/88, 1991/92, 1994/95, 2002/03, 2004/05, 2006/07 and 2009/10 ENs). The light blue shading indicates the inter-case spread, which is estimated with the inter-case standard deviation of the regular EN events. The magenta dashed lines divide the development of 2015EN into two stages, i.e., the initial developing stage (FMAMJJ[0]) and the late developing stage ([ASON[0]]). Here year[0] and year[−1] indicate the year of an EN event and the preceding year, respectively. This figure was generated by the NCAR Command Language (NCL, version 6.2.1, [Software]. (2014). Boulder, Colorado: UCAR/NCAR/CISL/VETS. http://dx.doi.org/10.5065/D6WD3XH5) and the licensed Microsoft PowerPoint.
Figure 2
Figure 2
The evolution of the sea surface height anomaly (SSH′; a proxy of D′) from GODAS for ON[−1], D[−1]J[0], FM[0] and AM[0], derived from (a) the composite of TR-super EN and (b) 2015EN. Here a linear D′−SSH′ relationship was applied. All plots were generated by the NCAR Command Language (NCL, version 6.2.1, [Software]. (2014). Boulder, Colorado: UCAR/NCAR/CISL/VETS. http://dx.doi.org/10.5065/D6WD3XH5).
Figure 3
Figure 3
Evolution of (a) the zonal wind stress anomaly (Taux′), (b) WWE-Taux′, and (c) 20 °C isotherm depth anomaly along the equator, from Dec 1, 2014 to July 31, 2015. The Taux′ and WWE-Taux′ are derived from the zonal wind stress (Taux) daily data covering 1979–2015. See the main text for the detailed derivation method. Figure 3c is derived from the TAO/TRITON observation provided by PMEL. (d) Time series of the accumulated WWE-index, which is obtained through integrating the WWE-index for the period of January–March (JFM; red curve), May–July (MJJ; blue curve) and January–July (JFMAMJJ; green curve) of each year. The WWE-index in a given day is obtained by integrating the WWE-Taux′ over WWE region (see detailed description in Method). Figure 3a,b,c were generated by the NCAR Command Language (NCL, version 6.2.1, [Software]. (2014). Boulder, Colorado: UCAR/NCAR/CISL/VETS. http://dx.doi.org/10.5065/D6WD3XH5), and Fig. 3d was generated by the licensed Microsoft Excel.
Figure 4
Figure 4
Month-to-month evolution of the sea surface height anomaly (unit: m; SSH′; a proxy of D′) from December 2014 to May 2015 in (a) GODAS, (b) CNTL run and (c) No-WWE run. All plots were generated by the NCAR Command Language (NCL, version 6.2.1, [Software]. (2014). Boulder, Colorado: UCAR/NCAR/CISL/VETS. http://dx.doi.org/10.5065/D6WD3XH5).
Figure 5
Figure 5
(a) Scatterplot of the Jan–Jul (0) accumulated WWE index and the precursory D′ signal for each El Niño event during 1979–2015. Here the precursory D′ signal is estimated by the Aug–Nov(−1) averaged sea surface height anomaly (a proxy of D′) over the tropical western Pacific (130°E–180°, 10°S–10°N). (b) same as (a) but for the accumulated “W + E” index, which is the summation of the accumulated WWE and accumulated EWE index. It shows that when taking into account the role of easterlies, the spreading between 2015 EN and other ENs revealed by the “W + E” index (Fig. 5b) resembles that revealed by the WWE index alone (Fig. 5a). The specific calculation of the accumulated WWE, EWE, and “W + E” index is introduced in the method section. This figure was generated by the licensed Microsoft Excel.

References

    1. Philander, S. G. H. In El Niño, La Niña, and the Southern Oscillation, Vol. 46 (eds Dmowska, R. et al.) Ch. 1, 9–12 (Academic press, 1990).
    1. McPhaden MJ, Zebiak SE, Glantz MH. ENSO as an Integrating Concept in Earth Science. Science. 2006;314:1740–1745. doi: 10.1126/science.1132588. - DOI - PubMed
    1. Hong LC, Ho L, Jin FF. A Southern Hemisphere booster of super El Niño. Geophysical research letters. 2014;41:2142–2149. doi: 10.1002/2014GL059370. - DOI
    1. Latif M, Semenov V, Park W. Super El Niños in response to global warming in a climate model. Climatic Change. 2015;132:489–500. doi: 10.1007/s10584-015-1439-6. - DOI
    1. Bouma MJ, Kovats RS, Goubet SA, Cox JSH, Haines A. Global assessment of El Niño’s disaster burden. Lancet. 1997;350:1435–1438. doi: 10.1016/S0140-6736(97)04509-1. - DOI - PubMed

Publication types