

Left ventricular hemodynamic forces as a marker of mechanical dyssynchrony in heart failure patients with left bundle branch block
- PMID: 28592851
- PMCID: PMC5462838
- DOI: 10.1038/s41598-017-03089-x
Left ventricular hemodynamic forces as a marker of mechanical dyssynchrony in heart failure patients with left bundle branch block
Abstract
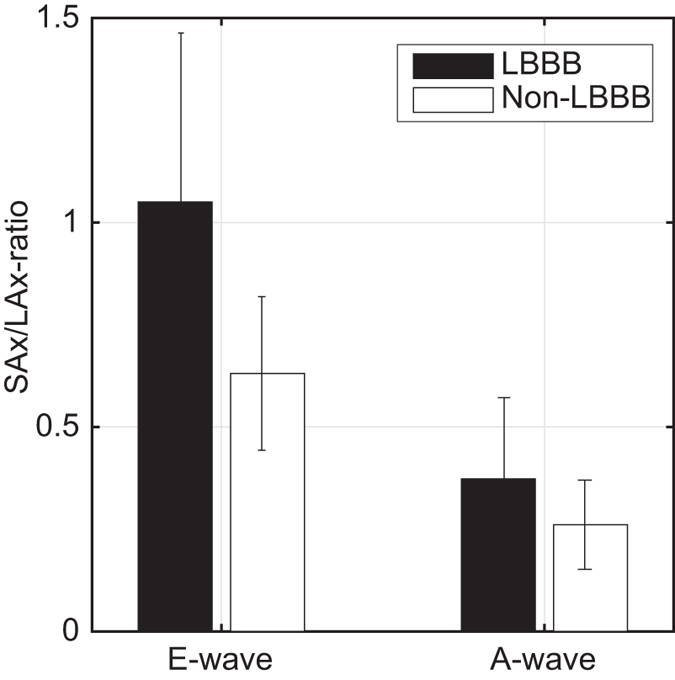
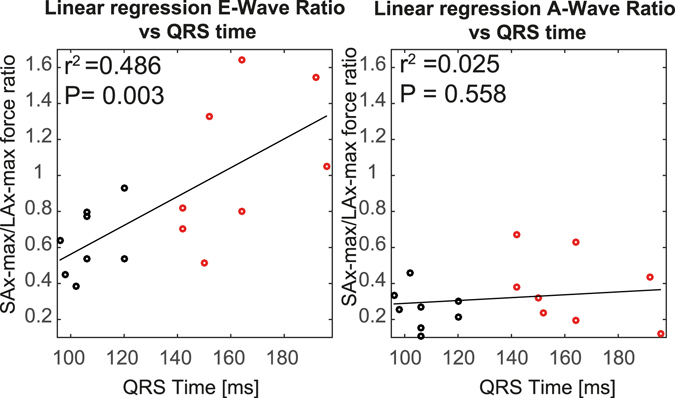
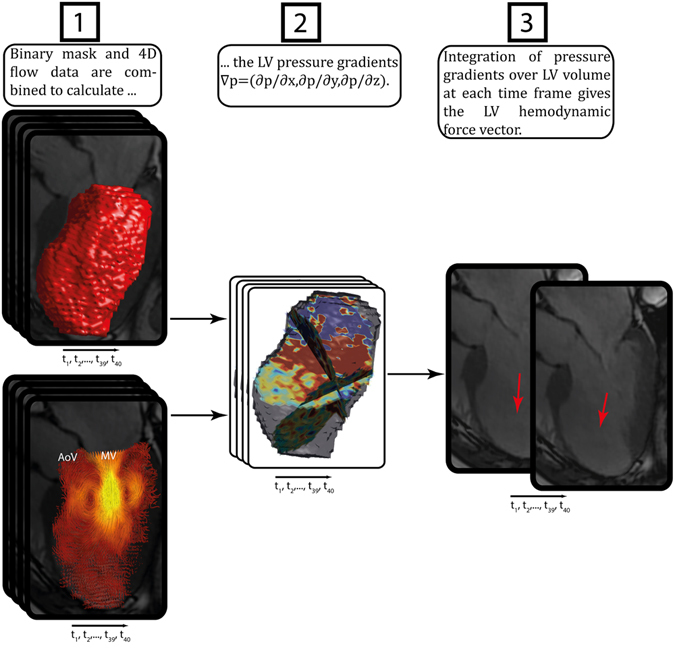
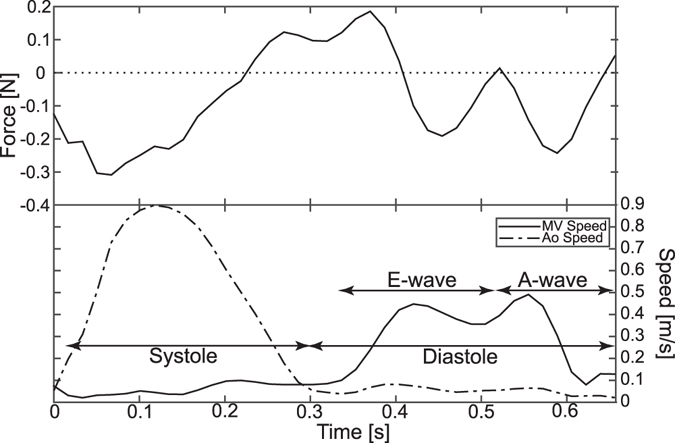
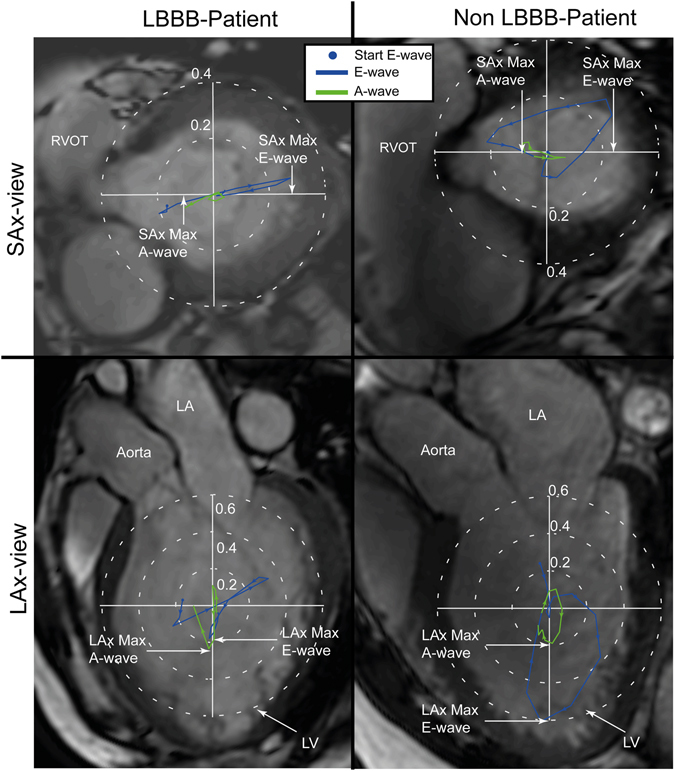
Left bundle branch block (LBBB) causes left ventricular (LV) dyssynchrony which is often associated with heart failure. A significant proportion of heart failure patients do not demonstrate clinical improvement despite cardiac resynchronization therapy (CRT). How LBBB-related effects on LV diastolic function may contribute to those therapeutic failures has not been clarified. We hypothesized that LV hemodynamic forces calculated from 4D flow MRI could serve as a marker of diastolic mechanical dyssynchrony in LBBB hearts. MRI data were acquired in heart failure patients with LBBB or matched patients without LBBB. LV pressure gradients were calculated from the Navier-Stokes equations. Integration of the pressure gradients over the LV volume rendered the hemodynamic forces. The findings demonstrate that the LV filling forces are more orthogonal to the main LV flow direction in heart failure patients with LBBB compared to those without LBBB during early but not late diastole. The greater the conduction abnormality the greater the discordance of LV filling force with the predominant LV flow direction (r2 = 0.49). Such unique flow-specific measures of mechanical dyssynchrony may serve as an additional tool for considering the risks imposed by conduction abnormalities in heart failure patients and prove to be useful in predicting response to CRT.
Conflict of interest statement
The authors declare that they have no competing interests.
Figures
Similar articles
-
Mechanical dyssynchrony alters left ventricular flow energetics in failing hearts with LBBB: a 4D flow CMR pilot study.Int J Cardiovasc Imaging. 2018 Apr;34(4):587-596. doi: 10.1007/s10554-017-1261-5. Epub 2017 Nov 2. Int J Cardiovasc Imaging. 2018. PMID: 29098524 Free PMC article.
-
Accuracy of left ventricular mechanical dyssynchrony indices for mechanical characteristics of left bundle branch block using cardiovascular magnetic resonance feature tracking.Eur Heart J Cardiovasc Imaging. 2025 Mar 3;26(3):435-443. doi: 10.1093/ehjci/jeae301. Eur Heart J Cardiovasc Imaging. 2025. PMID: 39576753 Free PMC article.
-
Mechanism of harm from left bundle branch block.Trends Cardiovasc Med. 2019 Aug;29(6):335-342. doi: 10.1016/j.tcm.2018.10.012. Epub 2018 Oct 25. Trends Cardiovasc Med. 2019. PMID: 30401603 Review.
-
Cardiovascular magnetic resonance features of mechanical dyssynchrony in patients with left bundle branch block.Int J Cardiovasc Imaging. 2016 Sep;32(9):1427-1438. doi: 10.1007/s10554-016-0925-x. Epub 2016 Jun 15. Int J Cardiovasc Imaging. 2016. PMID: 27306621
-
Assessment of mechanical dyssynchrony in cardiac resynchronization therapy.Dan Med J. 2014 Dec;61(12):B4981. Dan Med J. 2014. PMID: 25441737 Review.
Cited by
-
Cardiac fluid dynamics meets deformation imaging.Cardiovasc Ultrasound. 2018 Feb 20;16(1):4. doi: 10.1186/s12947-018-0122-2. Cardiovasc Ultrasound. 2018. PMID: 29458381 Free PMC article. Review.
-
Impact of intraventricular haemodynamic forces misalignment on left ventricular remodelling after myocardial infarction.ESC Heart Fail. 2022 Feb;9(1):496-505. doi: 10.1002/ehf2.13719. Epub 2021 Dec 23. ESC Heart Fail. 2022. PMID: 34939359 Free PMC article.
-
Surrogate models provide new insights on metrics based on blood flow for the assessment of left ventricular function.Sci Rep. 2022 May 24;12(1):8695. doi: 10.1038/s41598-022-12560-3. Sci Rep. 2022. PMID: 35610287 Free PMC article.
-
Evaluation of Left Ventricular Function Using Four-Dimensional Flow Cardiovascular Magnetic Resonance: A Systematic Review.J Cardiovasc Dev Dis. 2022 Sep 12;9(9):304. doi: 10.3390/jcdd9090304. J Cardiovasc Dev Dis. 2022. PMID: 36135449 Free PMC article. Review.
-
Evaluation of left ventricular blood flow kinetic energy in patients with acute myocardial infarction by 4D Flow MRI: a preliminary study.BMC Med Imaging. 2024 Jun 5;24(1):131. doi: 10.1186/s12880-024-01310-8. BMC Med Imaging. 2024. PMID: 38840059 Free PMC article.
References
-
- Baldasseroni S, et al. Left bundle-branch block is associated with increased 1-year sudden and total mortality rate in 5517 outpatients with congestive heart failure: a report from the Italian network on congestive heart failure. American heart journal. 2002;143:398–405. doi: 10.1067/mhj.2002.121264. - DOI - PubMed
-
- Carlsson M, Heiberg E, Töger J, Arheden H. Quantification of left and right ventricular kinetic energy using four-dimensional intracardiac magnetic resonance imaging flow measurements. American Journal of Physiology-Heart and Circulatory Physiology. 2012;302:H893–H900. doi: 10.1152/ajpheart.00942.2011. - DOI - PubMed
Publication types
MeSH terms
Substances
Grants and funding
LinkOut - more resources
Full Text Sources
Other Literature Sources
Medical
Molecular Biology Databases
Research Materials
