Transcriptomic analysis of short-fruit 1 (sf1) reveals new insights into the variation of fruit-related traits in Cucumis sativus
- PMID: 28592854
- PMCID: PMC5462832
- DOI: 10.1038/s41598-017-02932-5
Transcriptomic analysis of short-fruit 1 (sf1) reveals new insights into the variation of fruit-related traits in Cucumis sativus
Abstract
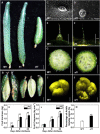
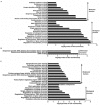
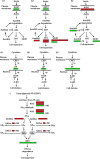
Fruit size is an important quality trait in different market classes of Cucumis sativus L., an economically important vegetable cultivated worldwide, but the genetic and molecular mechanisms that control fruit size are largely unknown. In this study, we isolated a natural cucumber mutant, short fruit 1 (sf1), caused by a single recessive Mendelian factor, from the North China-type inbred line CNS2. In addition to significantly decreased fruit length, other fruit-related phenotypic variations were also observed in sf1 compared to the wild-type (WT) phenotype, indicating that sf1 might have pleiotropic effects. Microscopic imaging showed that fruit cell size in sf1 was much larger than that in WT, suggesting that the short fruit phenotype in sf1 is caused by decreased cell number. Fine mapping revealed that sf1 was localized to a 174.3 kb region on chromosome 6. Similarly, SNP association analysis of bulked segregant RNA-Seq data showed increased SNP frequency in the same region of chromosome 6. In addition, transcriptomic analysis revealed that sf1 might control fruit length through the fine-tuning of cytokinin and auxin signalling, gibberellin biosynthesis and signal transduction in cucumber fruits. Overall, our results provide important information for further study of fruit length and other fruit-related features in cucumber.
Conflict of interest statement
The authors declare that they have no competing interests.
Figures


Similar articles
-
An irregularly striped rind mutant reveals new insight into the function of PG1β in cucumber (Cucumis sativus L.).Theor Appl Genet. 2020 Feb;133(2):371-382. doi: 10.1007/s00122-019-03468-0. Epub 2019 Nov 16. Theor Appl Genet. 2020. PMID: 31734868
-
Fine Mapping and Candidate Gene Prediction for White Immature Fruit Skin in Cucumber (Cucumis sativus L.).Int J Mol Sci. 2018 May 17;19(5):1493. doi: 10.3390/ijms19051493. Int J Mol Sci. 2018. PMID: 29772757 Free PMC article.
-
A fragment substitution in the promoter of CsHDZIV11/CsGL3 is responsible for fruit spine density in cucumber (Cucumis sativus L.).Theor Appl Genet. 2016 Jul;129(7):1289-1301. doi: 10.1007/s00122-016-2703-5. Epub 2016 Mar 25. Theor Appl Genet. 2016. PMID: 27015676
-
Molecular basis of cucumber fruit domestication.Curr Opin Plant Biol. 2019 Feb;47:38-46. doi: 10.1016/j.pbi.2018.08.006. Epub 2018 Sep 22. Curr Opin Plant Biol. 2019. PMID: 30253288 Review.
-
Recent progress on the molecular breeding of Cucumis sativus L. in China.Theor Appl Genet. 2020 May;133(5):1777-1790. doi: 10.1007/s00122-019-03484-0. Epub 2019 Nov 21. Theor Appl Genet. 2020. PMID: 31754760 Review.
Cited by
-
Ectopic Expression of CsSUN in Tomato Results in Elongated Fruit Shape via Regulation of Longitudinal Cell Division.Int J Mol Sci. 2022 Sep 1;23(17):9973. doi: 10.3390/ijms23179973. Int J Mol Sci. 2022. PMID: 36077369 Free PMC article.
-
How different of the rhizospheric and endophytic microbial compositions in watermelons with different fruit shapes.PLoS One. 2024 May 16;19(5):e0302462. doi: 10.1371/journal.pone.0302462. eCollection 2024. PLoS One. 2024. PMID: 38753836 Free PMC article.
-
Morphological Characterization and Integrated Transcriptome and Proteome Analysis of Organ Development Defective 1 (odd1) Mutant in Cucumis sativus L.Int J Mol Sci. 2022 May 23;23(10):5843. doi: 10.3390/ijms23105843. Int J Mol Sci. 2022. PMID: 35628653 Free PMC article.
-
Genome-wide association study of the candidate genes for grape berry shape-related traits.BMC Plant Biol. 2022 Jan 20;22(1):42. doi: 10.1186/s12870-022-03434-x. BMC Plant Biol. 2022. PMID: 35057757 Free PMC article.
-
Localization of quantitative trait loci for cucumber fruit shape by a population of chromosome segment substitution lines.Sci Rep. 2020 Jul 3;10(1):11030. doi: 10.1038/s41598-020-68312-8. Sci Rep. 2020. PMID: 32620915 Free PMC article.
References
-
- Serquen FC, Bacher J, Staub JE. Mapping and QTL analysis of horticultural traits in a narrow cross in cucumber (Cucumis sativas L.) using random amplified polymorphic DNA markers. Mol Breed. 1997;3:257–268. doi: 10.1023/A:1009689002015. - DOI
-
- Yuan XJ, et al. Genetic linkage map construction and location of QTLs for fruit-related traits in cucumber. Plant Breeding. 2008;127:180–188. doi: 10.1111/j.1439-0523.2007.01426.x. - DOI
-
- Bo K, Ma Z, Chen J, Weng Y. Molecular mapping reveals structural rearrangements and quantitative trait loci underlying traits with local adaptation in semi-wild Xishuangbanna cucumber (Cucumis sativus L. var. xishuangbannanesis Qi et Yuan) Theor Appl Genet. 2015;128:25–39. doi: 10.1007/s00122-014-2410-z. - DOI - PubMed
Publication types
MeSH terms
Substances
LinkOut - more resources
Full Text Sources
Other Literature Sources

