

Identification of unique cardiolipin and monolysocardiolipin species in Acinetobacter baumannii
- PMID: 28592862
- PMCID: PMC5462836
- DOI: 10.1038/s41598-017-03214-w
Identification of unique cardiolipin and monolysocardiolipin species in Acinetobacter baumannii
Abstract
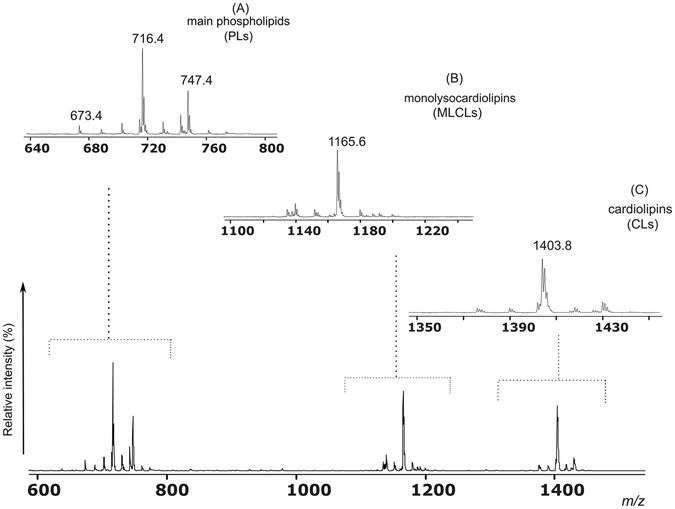
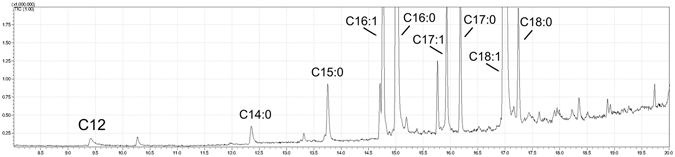
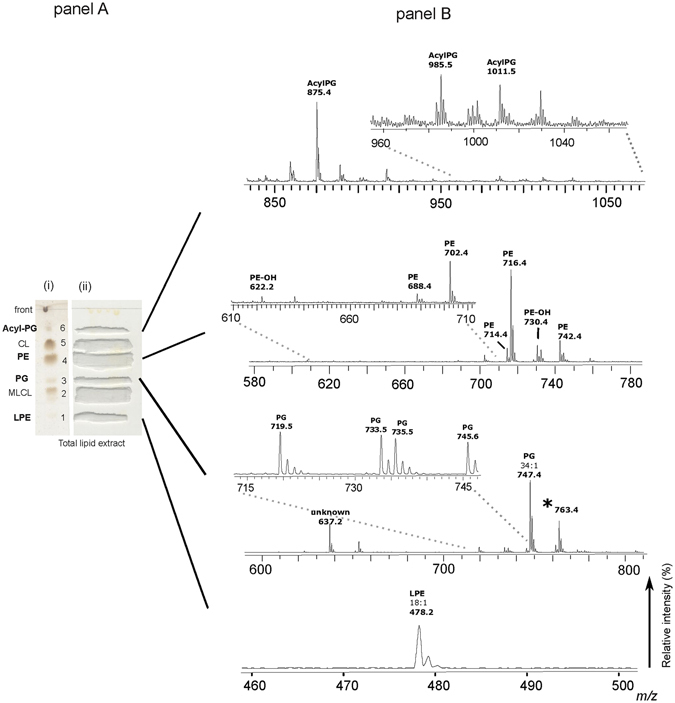
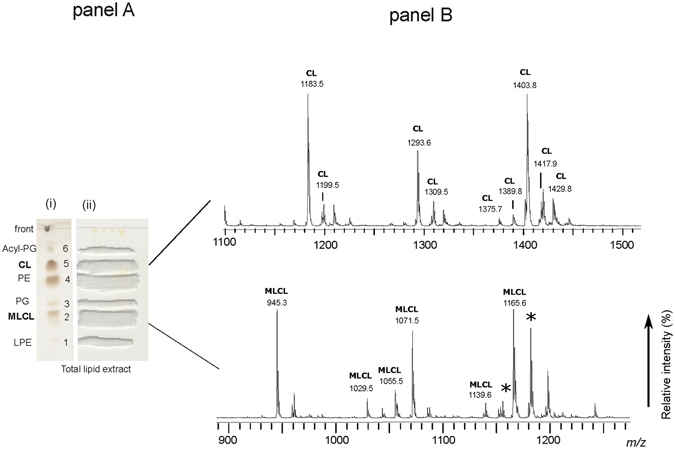
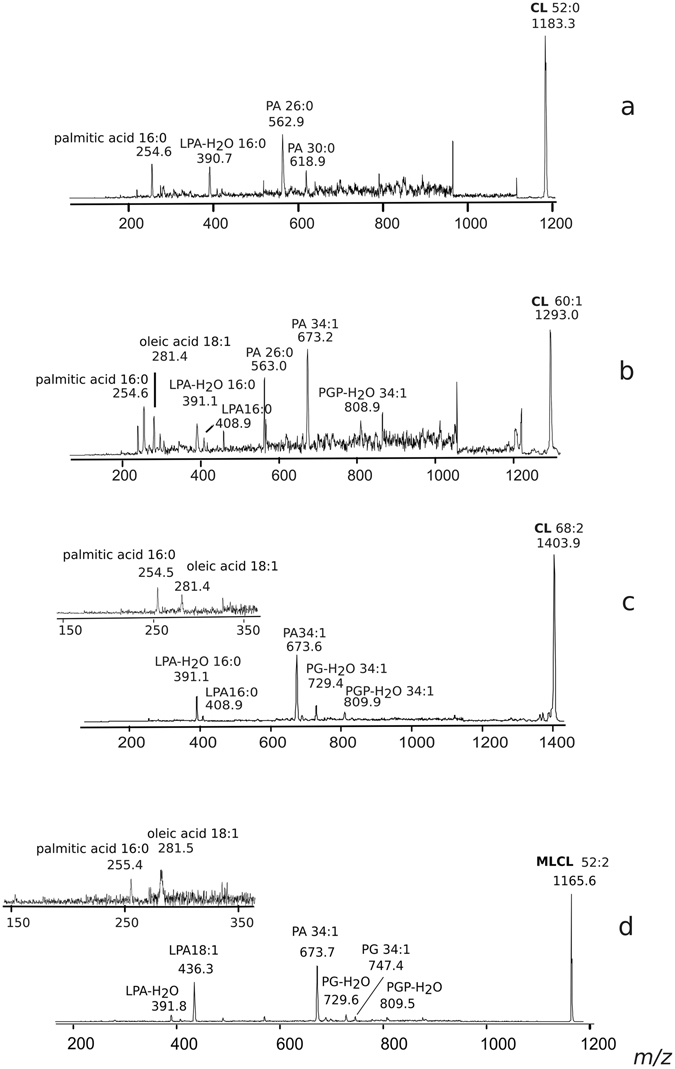
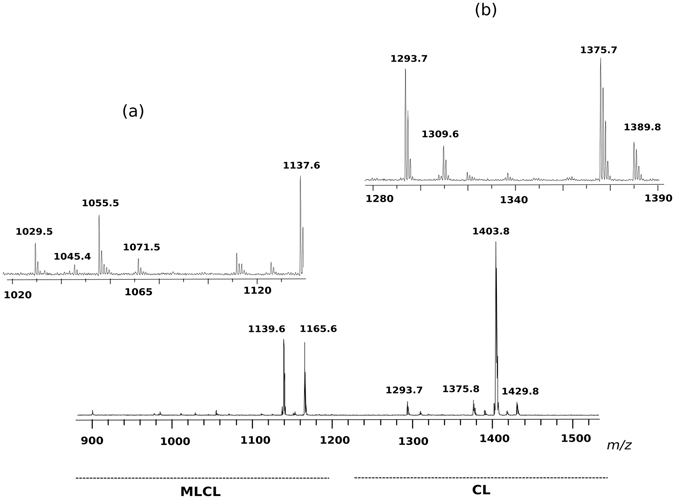
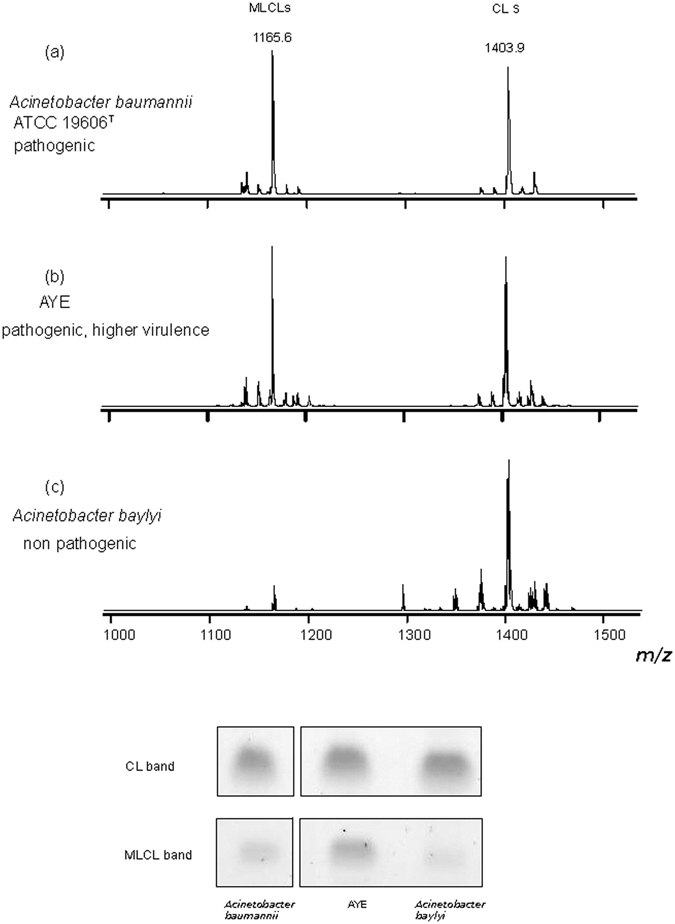
Acidic glycerophospholipids play an important role in determining the resistance of Gram-negative bacteria to stress conditions and antibiotics. Acinetobacter baumannii, an opportunistic human pathogen which is responsible for an increasing number of nosocomial infections, exhibits broad antibiotic resistances. Here lipids of A. baumannii have been analyzed by combined MALDI-TOF/MS and TLC analyses; in addition GC-MS analyses of fatty acid methyl esters released by methanolysis of membrane phospholipids have been performed. The main glycerophospholipids are phosphatidylethanolamine, phosphatidylglycerol, acyl-phosphatidylglycerol and cardiolipin together with monolysocardiolipin, a lysophospholipid only rarely detected in bacterial membranes. The major acyl chains in the phospholipids are C16:0 and C18:1, plus minor amounts of short chain fatty acids. The structures of the cardiolipin and monolysocardiolipin have been elucidated by post source decay mass spectrometry analysis. A large variety of cardiolipin and monolysocardiolipin species were found in A. baumannii. Similar lysocardiolipin levels were found in the two clinical strains A. baumannii ATCC19606T and AYE whereas in the nonpathogenic strain Acinetobacter baylyi ADP1 lysocardiolipin levels were highly reduced.
Conflict of interest statement
The authors declare that they have no competing interests.
Figures
Similar articles
-
Lipidomic analysis of lactic acid bacteria strains by matrix-assisted laser desorption/ionization time-of-flight mass spectrometry.J Dairy Sci. 2020 Dec;103(12):11062-11078. doi: 10.3168/jds.2020-18753. Epub 2020 Oct 9. J Dairy Sci. 2020. PMID: 33041037
-
Identification of Acinetobacter Species Using Matrix-Assisted Laser Desorption Ionization-Time of Flight Mass Spectrometry.Ann Lab Med. 2016 Jul;36(4):325-34. doi: 10.3343/alm.2016.36.4.325. Ann Lab Med. 2016. PMID: 27139605 Free PMC article.
-
Using Vitek MALDI-TOF mass spectrometry to identify species belonging to the Acinetobacter calcoaceticus-Acinetobacter baumannii complex: a relevant alternative to molecular biology?Diagn Microbiol Infect Dis. 2015 Oct;83(2):99-104. doi: 10.1016/j.diagmicrobio.2015.06.009. Epub 2015 Jun 17. Diagn Microbiol Infect Dis. 2015. PMID: 26198329
-
Multidrug resistant Acinetobacter baumannii--the role of AdeABC (RND family) efflux pump in resistance to antibiotics.Folia Histochem Cytobiol. 2008;46(3):257-67. doi: 10.2478/v10042-008-0056-x. Folia Histochem Cytobiol. 2008. PMID: 19056528 Review.
-
Mass spectrometry analysis of oxidized phospholipids.Chem Phys Lipids. 2008 Nov;156(1-2):1-12. doi: 10.1016/j.chemphyslip.2008.07.003. Epub 2008 Jul 11. Chem Phys Lipids. 2008. PMID: 18671956 Review.
Cited by
-
Nutrient depletion-induced production of tri-acylated glycerophospholipids in Acinetobacter radioresistens.Sci Rep. 2018 May 10;8(1):7470. doi: 10.1038/s41598-018-25869-9. Sci Rep. 2018. PMID: 29748546 Free PMC article.
-
Alternative lipid synthesis in response to phosphate limitation promotes antibiotic tolerance in Gram-negative ESKAPE pathogens.PLoS Pathog. 2025 Feb 7;21(2):e1012933. doi: 10.1371/journal.ppat.1012933. eCollection 2025 Feb. PLoS Pathog. 2025. PMID: 39919117 Free PMC article.
-
Lipidomic analyses reveal distinctive variations in homeoviscous adaptation among clinical strains of Acinetobacter baumannii, providing insights from an environmental adaptation perspective.Microbiol Spectr. 2024 Oct 3;12(10):e0075724. doi: 10.1128/spectrum.00757-24. Epub 2024 Sep 10. Microbiol Spectr. 2024. PMID: 39254344 Free PMC article.
-
Metabolomic profiles of the liquid state fermentation in co-culture of Eurotium amstelodami and Bacillus licheniformis.Front Microbiol. 2023 Jan 26;14:1080743. doi: 10.3389/fmicb.2023.1080743. eCollection 2023. Front Microbiol. 2023. PMID: 36778878 Free PMC article.
-
The Influence of Supplemental Dietary Linoleic Acid on Skeletal Muscle Contractile Function in a Rodent Model of Barth Syndrome.Front Physiol. 2021 Aug 19;12:731961. doi: 10.3389/fphys.2021.731961. eCollection 2021. Front Physiol. 2021. PMID: 34489741 Free PMC article.
References
Publication types
MeSH terms
Substances
LinkOut - more resources
Full Text Sources
Other Literature Sources
Molecular Biology Databases
Miscellaneous
