. 2017 Jun 7;7(1):2976.
doi: 10.1038/s41598-017-03320-9.

Incorporation of Fluorescence Ceramide-Based HPLC Assay for Rapidly and Efficiently Assessing Glucosylceramide Synthase In Vivo

Affiliations

Incorporation of Fluorescence Ceramide-Based HPLC Assay for Rapidly and Efficiently Assessing Glucosylceramide Synthase In Vivo

Sachin K Khiste et al. Sci Rep. .

Abstract

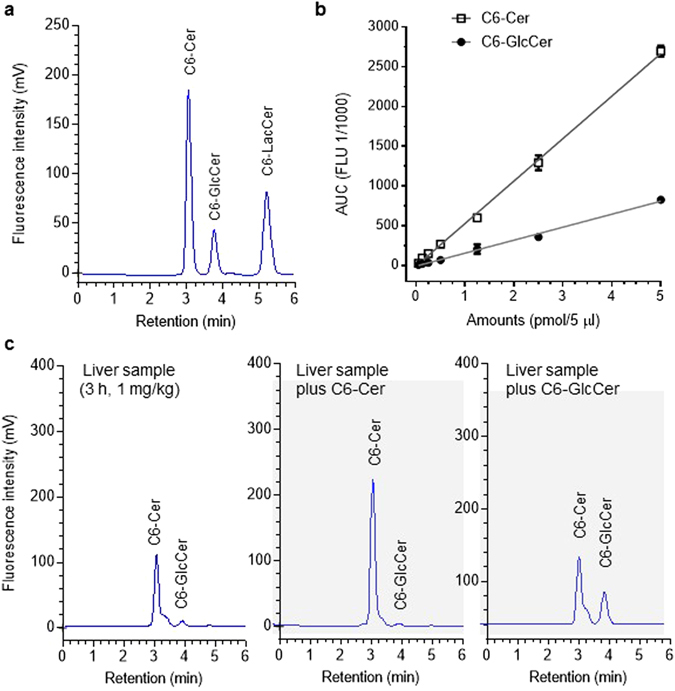
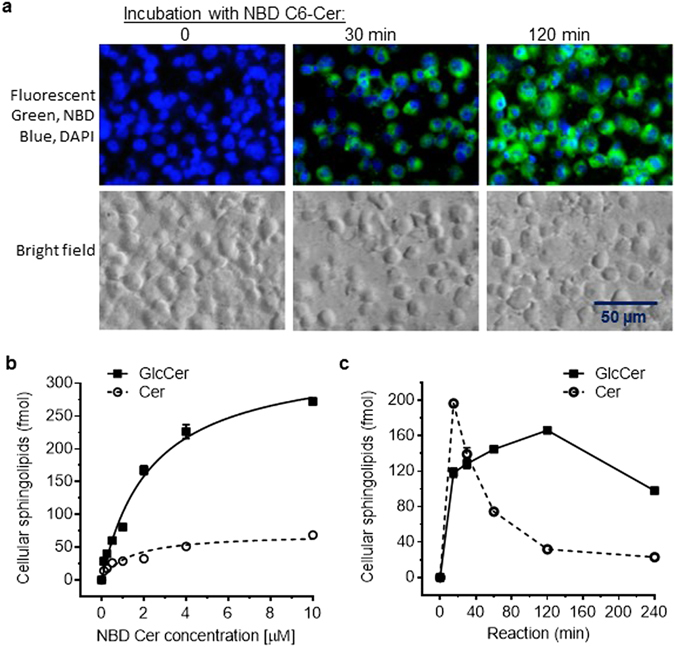
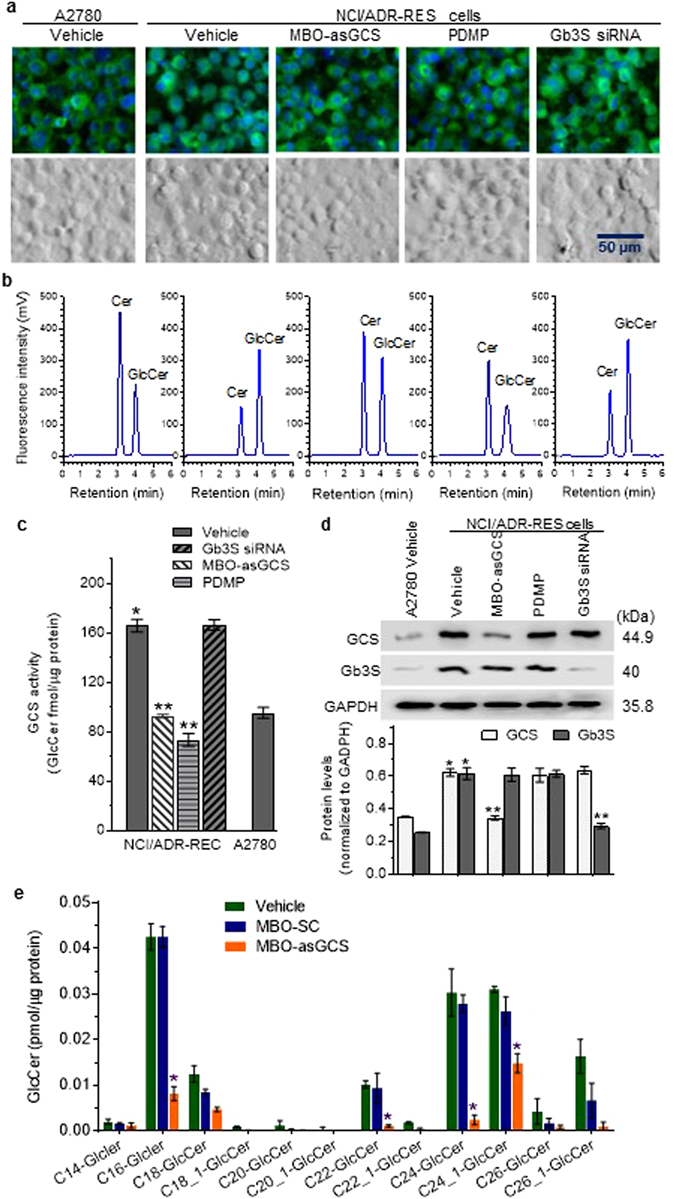
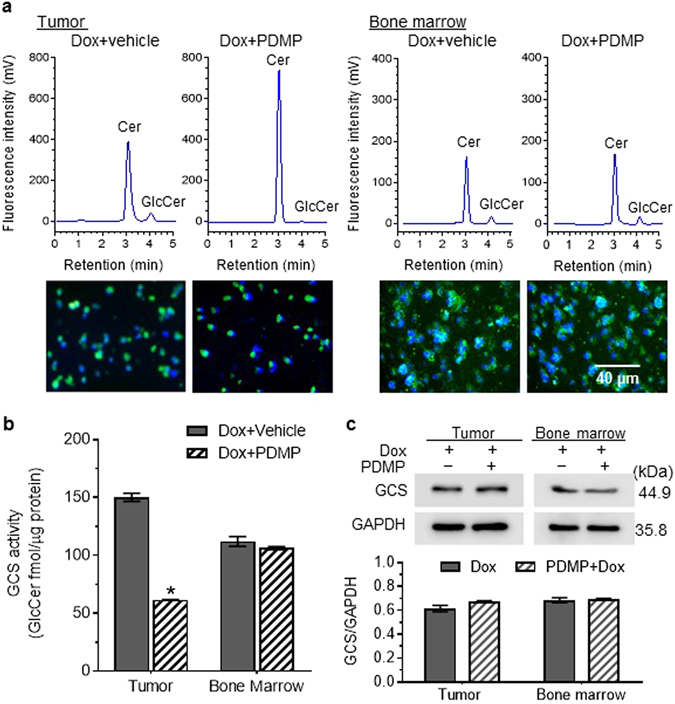
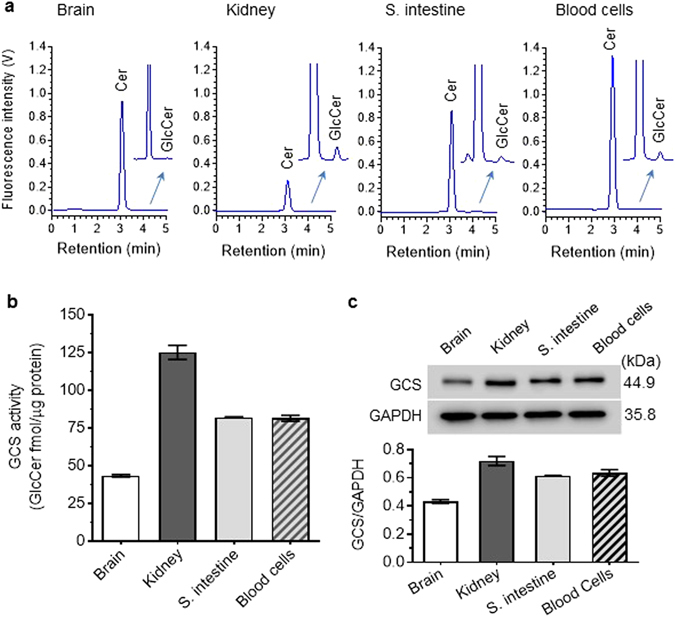
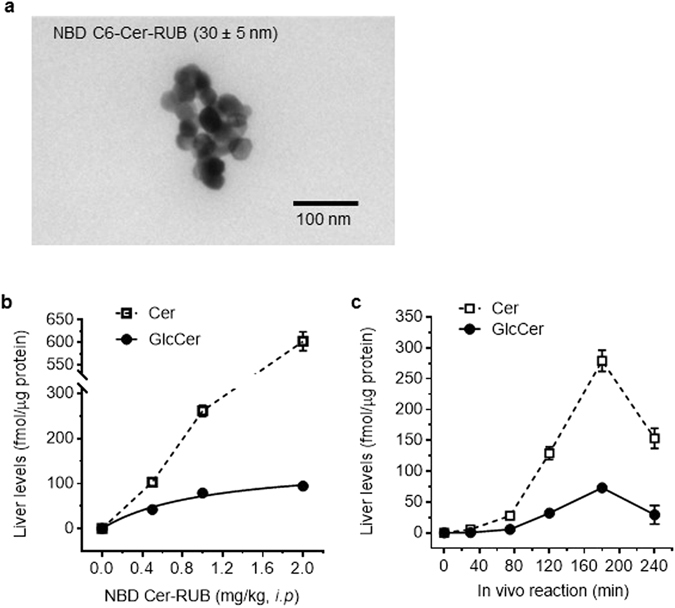
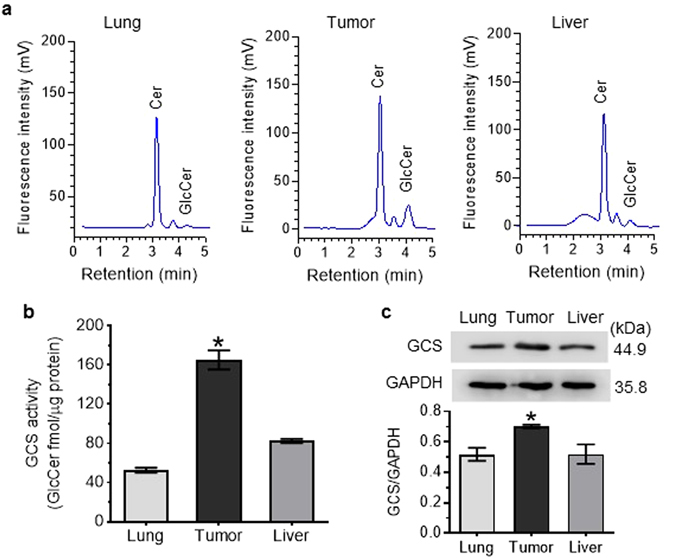
Glucosylceramide synthase (GCS) is a rate-limiting enzyme catalyzing ceramide glycosylation, thereby regulating cellular ceramide levels and the synthesis of glycosphingolipids (GSLs) in cellular membranes. Alterations of GCS not only affect membrane integrity, but also closely correlate with stem cell pluripotency, cancer drug resistance, GSL storage disorders and other diseases. Enzyme activities measured conventionally with currently available ex-vivo methods do not enable reliable assessment of the roles played by GCS in vivo. We report herein a substrate-incorporation method enabling rapid and efficient assessment of GCS in-vivo activity. Upon nanoparticle-based delivery, fluorescent NBD C6-ceramide was efficiently converted to NBD C6-glucosylceramide in live cells or in mouse tissues, whereupon an HPLC assay enabled detection and quantification of NBD C6-glucosylceramide in the low-femtomolar range. The enzyme kinetics of GCS in live cells and mouse liver were well-described by the Michaelis-Menten model. GCS activities were significantly higher in drug-resistant cancer cells and in tumors overexpressing GCS, but reduced after silencing GCS expression or inhibiting this enzyme. Our studies indicate that this rapid and efficient method provides a valuable means for accurately assessing the roles played by GCS in normal vs. pathological states, including ones involving cancer drug resistance.


Conflict of interest statement

The authors declare that they have no competing interests.

Figures

Figure 1
Figure 1
HPLC analysis of NBD C6-Cer and C6-GlcCer. (a) HPLC chromatogram of sphingolipids. A mixed standard of NBD C6-Cer, C6-GlcCer and C6-LacCer (1:1:1, 0.5 pmol each) was separated and quantitated by HPLC with fluorescence detection. The retention times for C6-Cer, C6-GlcCer and C6-LacCer were 3.1, 3.9, and 5.2 min, respectively. (b) Quantitation of C6-Cer and C6-GlcCer. Increasing amounts of mixtures of NBD C6-Cer and C6-GlcCer (1:1) were resolved and analyzed by HPLC. Each data point represents mean ± SD of three independent experiments. The correlation coefficients for NBD C6-Cer and NBD C6-GlcCer were 0.99 and 0.99, respectively. (c) Characterization of NBD C6-Cer and C6-GlcCer in mouse liver. Lipids extracted from livers of mice after administration of NBD C6-Cer-RUB (1 mg/kg, i.p.; 180 min) were spiked with NBD C6-Cer (0.25 pmol) or C6-GlcCer (0.25 pmol) and analyzed by HPLC.
Figure 2
Figure 2
Determination of NBD C6-Cer glycosylation in cells. NCI/ADR-RES cells cultured for 24 hr were switched to 1% BSA RPMI-1640 medium containing NBD C6-Cer for enzymatic reactions. (a) Fluorescent NBD-sphingolipids in cells after incubations with 2 µM NBD C6-Cer. Green, NBD-sphingolipids; Blue, DAPI-nuclei. Images (200× magnification) were captured using an EVOS FL cell imaging system. (b) Dose-response for Cer glycosylation by GCS. Cells were incubated with NBD C6-Cer for 2 h. The correlation coefficient for cellular C6-Cer (dashed line) to NBD C6-Cer in medium is 0.91, and for cellular C6-GlcCer (solid line) to NBD C6-Cer in medium is 0.99. (c) Time course of cellular Cer glycosylation. Cells were incubated with 2.0 µM of NBD C6-Cer for indicated periods. The correlation coefficient for cellular C6-GlcCer (solid line) to NBD C6-Cer in medium is 0.99. Results represent the mean ± SD of three independent enzyme reactions.
Figure 3
Figure 3
Glycosylation of NBD C6-Cer in cell lines expressing different levels of GCS. Glycosylation of NBD C6-Cer (2 µM, 2 h) was carried out with drug-sensitive A2780 ovarian cancer cells and drug-resistant NCI/ADR-RES cells after indicated treatments. (a) Fluorescent sphingolipids in cells after incubation with NBD C6-Cer. Green, NBD-sphingolipids; Blue, DAPI-nuclei. (b) Chromatograms of cellular sphingolipids. Cer and GlcCer were identified by their retention times, comparing with NBD C6-Cer and C6-GlcCer standards. (c) Intracellular GCS activities. *p < 0.001, compared to A2780 cells; **p < 0.001 compared to NCI/ADR-RES vehicle. Results are the mean ± SD of three independent experiments. (d) Western blotting of GCS protein. Equal amounts of detergent-soluble proteins (50 µg protein/lane) were resolved using 4–20% gradient SDS-PAGE, and then immunoblotted with antibodies for GCS or Gb3S and GAPDH. Protein levels of GCS and Gb3S are represented as ratios of GCS/GAPDH optical densities averaged from three blots. *p < 0.001, compared to A2780 cells; **p < 0.001 compared to vehicle. (e) Intracellular GlcCer speciation by ESI/MS/MS. Lipids from NCI/ADR-RES cells treated with MBO-asGCS (100 nM, 48 h) or MBO-SC (scrambled control) were analyzed, and the levels of GlcCer in samples expressed as fmol/µg protein, as normalized against total cellular protein. *p > 0.05 compared to MBO-SC or vehicle control.
Figure 4
Figure 4
Cer glycosylation by GCS in tumors and tissues. Mice bearing SW48/TP53 tumors were treated with doxorubicin (Dox) alone or combined with PDMP (4 mg/kg, every 3 days for 30 days; 5 cases/group). Cell suspensions of tumors and bone marrow (5 cases/group) were freshly prepared and incubated with NBD C6-Cer (2 µM, 2 h). (a) HPLC chromatograms and intracellular NBD sphingolipids. Cer and GlcCer were identified by retention times vs. NBD C6-Cer and C6-GlcCer standards. Green, NBD sphingolipids; Blue, DAPI-nuclei. Images (200× magnification) were captured using an EVOS FL cell imaging system. (b) GCS activities in tumor and bone marrow. *p < 0.001, as compared to Dox alone. (c) Western blotting of GCS in tumor and bone marrow. Equal amounts of detergent-soluble proteins (50 µg protein/lane) extracted were resolved using 4–20% gradient SDS-PAGE and then immunoblotted with antibodies for GCS or GAPDH. GCS protein levels are represented as ratios of GCS/GAPDH optical densities averaged from three blots.
Figure 5
Figure 5
Cer glycosylation by GCS in mouse tissues. (a) HPLC chromatograms. Cell suspensions of tissues freshly prepared (from 3 mice) were incubated with NBD C6-Cer (2 µM, 2 h), and the lipids analyzed by HPLC. Arrows indicate enlarged parts of the original chromatograms. (b) GCS activities in tissues. (c) Western blotting of GCS protein. S. intestine, small intestine. Equal amounts of proteins (50 µg protein/lane) were resolved, and then immunoblotted with antibodies for GCS or GAPDH. GCS protein levels are represented as ratios of GCS/GAPDH optical densities averaged from three blots.
Figure 6
Figure 6
NBD C6-Cer-RUB nanomicelles and ceramide glycosylation in mouse liver. (a) Transmission electron microscopy (TEM) of NBD C6-Cer-RUB nanomicelles. A representative TEM image revealed the formation of Cer-RUB nanomicelles with an average size of 30 ± 5 nm. Cer-RUB nanomicelles were dissolved in RPMI-1640 medium and intraperitoneally injected into mice, and 3 h after administration, liver was excised and lipids immediately extracted for HPLC analysis. (b) Dose-response for intra-organ Cer glycosylation in mice. NBD C6-Cer-RUB nanomicelles (0.5–2.0 mg/kg) were intraperitoneally injected into mice. The correlation coefficient for C6-Cer (dashed line) to NBD C6-Cer-RUB injected is 0.99, and for C6-GlcCer (solid line) is 0.98. (c) Time course of intra-organ Cer glycosylation. Liver lipids were extracted at indicated times following NBD C6-Cer-RUB administration (1 mg/kg). Results represent the mean ± SD of three independent experiments.
Figure 7
Figure 7
Intra-organ Cer glycosylation by GCS in mice. (a) HPLC chromatograms. NBD C6-Cer-RUB nanomicelles (1 mg/kg, i.p.; 4 cases/group) were administered to mice bearing an OVCAR-3 tumor xenograft; 3 h after injection, tissues were rapidly resected for lipid extraction and HPLC analysis. Approximately equal-fluorescence-unit samples of extracted sphingolipids were analyzed by HPLC. (b) Intra-organ GCS activities. *p < 0.001 compared to lung or liver. (c) Western blotting of tissue GCS. Equal amounts of proteins (50 µg protein/lane) extracted were resolved and then immunoblotted with antibodies for GCS or GAPDH. GCS protein levels are represented as ratios of GCS/GAPDH optical densities averaged from four blots. *p < 0.05 compared to lung or liver.

Similar articles

Cited by

References

    1. Basu S, Kaufman B, Roseman S. Enzymatic synthesis of ceramide-glucose and ceramide-lactose by glycosyltransferases from embryonic chicken brain. J Biol Chem. 1968;243:5802–4. - PubMed
    1. Ichikawa S, Sakiyama H, Suzuki G, Hidari KI, Hirabayashi Y. Expression cloning of a cDNA for human ceramide glucosyltransferase that catalyzes the first glycosylation step of glycosphingolipid synthesis. Proc Natl Acad Sci USA. 1996;93:4638–43. doi: 10.1073/pnas.93.10.4638. - DOI - PMC - PubMed
    1. D’Angelo G, Capasso S, Sticco L, Russo D. Glycosphingolipids: synthesis and functions. FEBS J. 2013;280:6338–53. doi: 10.1111/febs.12559. - DOI - PubMed
    1. Yu RK, Nakatani Y, Yanagisawa M. The role of glycosphingolipid metabolism in the developing brain. J Lipid Res. 2009;50(Suppl):S440–5. - PMC - PubMed
    1. Merrill AH., Jr. Sphingolipid and glycosphingolipid metabolic pathways in the era of sphingolipidomics. Chem Rev. 2011;111:6387–422. doi: 10.1021/cr2002917. - DOI - PMC - PubMed

Publication types