. 2017 Jun 7;7(1):2999.
doi: 10.1038/s41598-017-02871-1.

CT-Based Local Distribution Metric Improves Characterization of COPD

Affiliations

CT-Based Local Distribution Metric Improves Characterization of COPD

Benjamin A Hoff et al. Sci Rep. .

Abstract

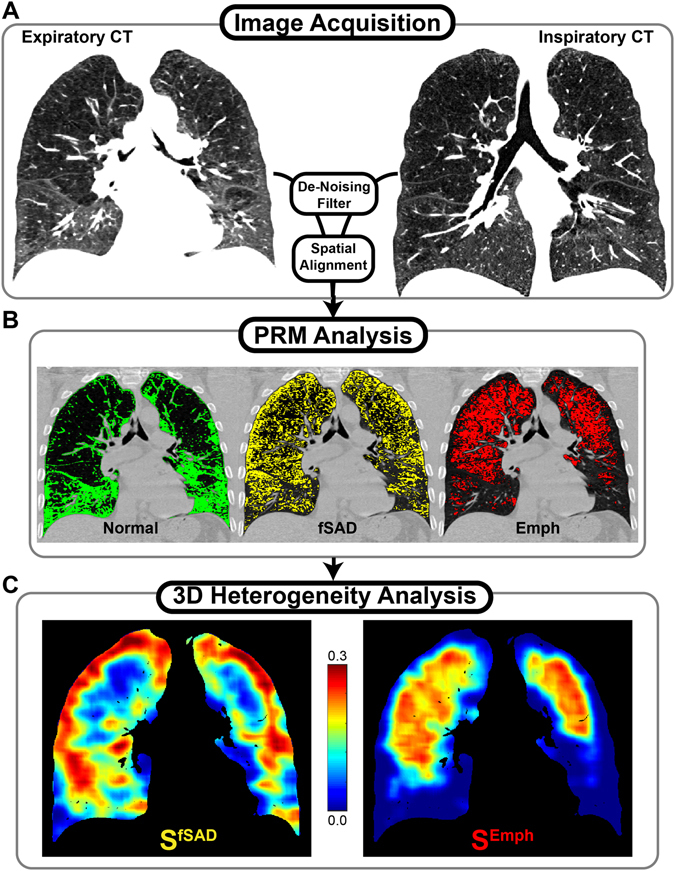
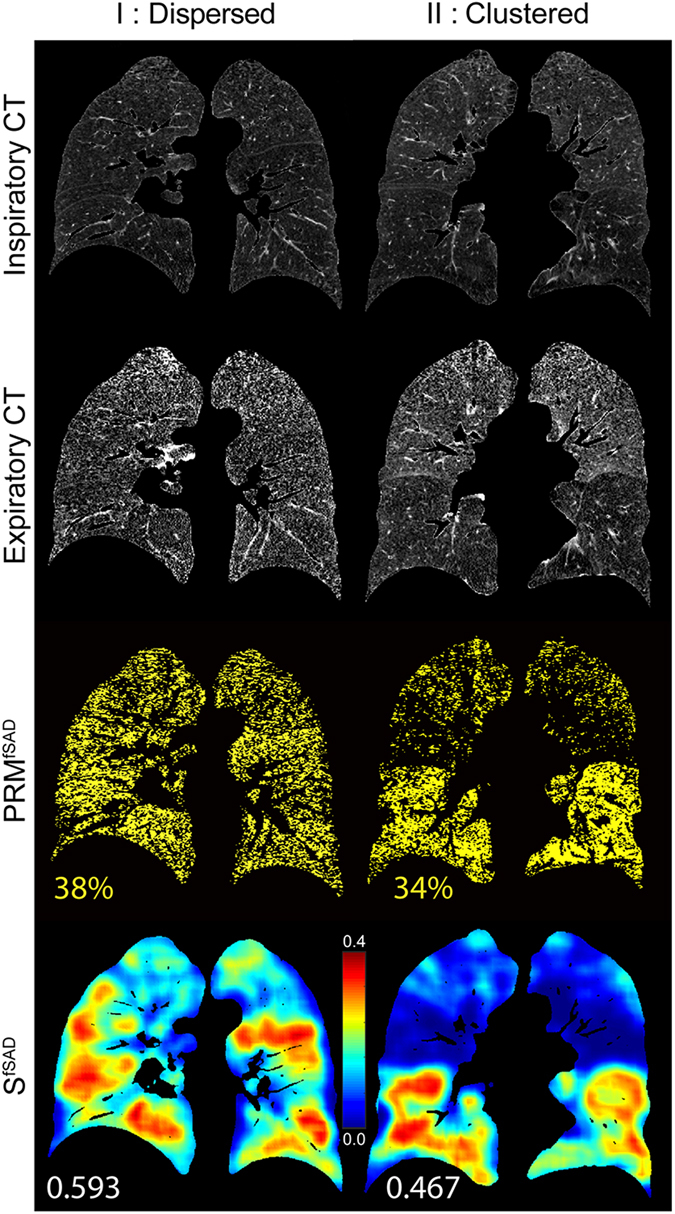
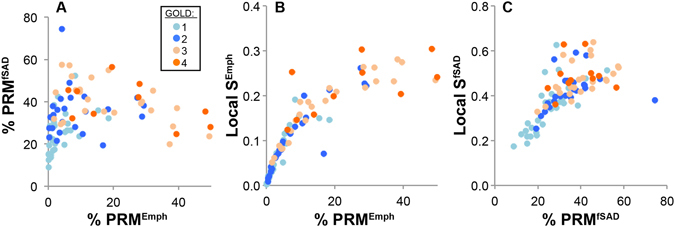
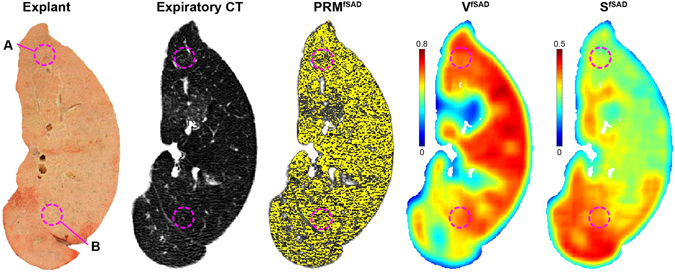
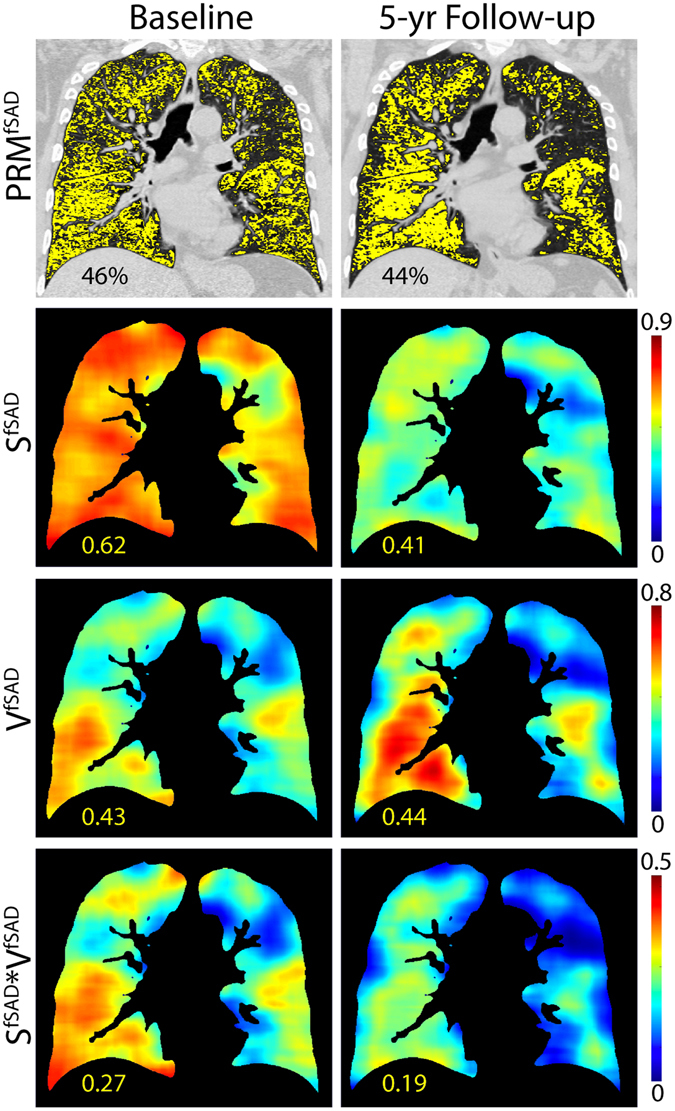
Parametric response mapping (PRM) of paired CT lung images has been shown to improve the phenotyping of COPD by allowing for the visualization and quantification of non-emphysematous air trapping component, referred to as functional small airways disease (fSAD). Although promising, large variability in the standard method for analyzing PRMfSAD has been observed. We postulate that representing the 3D PRMfSAD data as a single scalar quantity (relative volume of PRMfSAD) oversimplifies the original 3D data, limiting its potential to detect the subtle progression of COPD as well as varying subtypes. In this study, we propose a new approach to analyze PRM. Based on topological techniques, we generate 3D maps of local topological features from 3D PRMfSAD classification maps. We found that the surface area of fSAD (SfSAD) was the most robust and significant independent indicator of clinically meaningful measures of COPD. We also confirmed by micro-CT of human lung specimens that structural differences are associated with unique SfSAD patterns, and demonstrated longitudinal feature alterations occurred with worsening pulmonary function independent of an increase in disease extent. These findings suggest that our technique captures additional COPD characteristics, which may provide important opportunities for improved diagnosis of COPD patients.


Conflict of interest statement

E.P. has received an unrestricted educational grant for research from Astra Zeneca and Chiesi; fees for consultancies by E.P. were given to the University of Groningen by A.Z., Boehringer Ingelheim, Chiesi, G.S.K., Nycomed and TEVA. N.H.T.t.H. received grants from GlaxoSmithKline, Boehringer Ingelheim, Nycomed and Chiesi. C.J.G., B.D.R. and B.A.H. have a financial interest in the underlying patented University of Michigan technology licensed to Imbio, L.L.C., a company in which B.D.R. has a financial interest. S.G., P.A.d.J., F.A.A.M.H., L.K., T.D.J., and M.v.d.B. have no competing interests.

Figures

Figure 1
Figure 1
A schematic of the workflow is displayed for generating PRM topological maps. (A) CT images are acquired at expiration and inspiration. (B) PRM analysis is performed by first segmenting the lungs from the thoracic cavity. Then the CT images are filtered and spatially aligned to the expiration geometric frame. Individual voxels are then classified as normal (PRMNorm, green), functional small airways disease (PRMfSAD, yellow), or emphysema (PRMEmph, red). (C) Topological feature extraction is performed on each PRM classification binary map to determine topology metrics. Presented are surface area (S) maps for PRMfSAD (left) and PRMEmph (right).
Figure 2
Figure 2
Two cases are presented with varying topological PRM features. Both cases have near-identical spirometry readouts and PRMfSAD relative volumes yet display differing fSAD topological features: dispersed disease (I, left column) and clustered disease (II, right column). A representative slice is shown for each case for the respective (top to bottom) inspiratory CT, expiratory CT, PRMfSAD map, and Local SfSAD map (multiplied by Local VfSAD in order to emphasize regions of substantial disease). PRMfSAD relative volumes and Local SfSAD values are displayed for comparison.
Figure 3
Figure 3
Observable trends between PRM and topological PRM features. Scatter plots are presented for (A) %PRMEmph vs. %PRMfSAD, (B) %PRMEmph vs. Local SEmph and (C) %PRMfSAD vs. Local SfSAD. Markers are color-coded for GOLD 1 through 4 (see legend). Comparison between %PRMEmph and %PRMfSAD showed trends with increasing disease severity that has been observed in previously published work, . Local Si values and respective %PRMi values reveals a strong correlation at low volume fractions showing greater spread with increasing volume fractions.
Figure 4
Figure 4
Confirmation of topological features altered by tissue microenvironment. An explanted lung from a single subject diagnosed with bronchiolitis obliterans syndrome was analyzed by microCT. Presented are the explanted lung section, expiratory CT scan, PRMfSAD, Local VfSAD and Local SfSAD. All CT derived images were spatially aligned to the lung section, allowing identification of core regions (A,B) on PRM and topological maps.
Figure 5
Figure 5
A subject with COPD staged at baseline with GOLD-2 (first column) with 5-year follow-up (second column) revealing a progression to GOLD-3. No substantial change in %PRMfSAD was detected (first row), however a striking drop in Local SfSAD was found (second row). This demonstrates a potential pattern of progression, with diffuse disease coalescing into more focal distribution.

Similar articles

Cited by

References

    1. Adeloye D, et al. Global and regional estimates of COPD prevalence: Systematic review and meta-analysis. J Glob Health. 2015;5:020415. doi: 10.7189/jogh.05.020415. - DOI - PMC - PubMed
    1. Mannino DM, Buist AS. Global burden of COPD: risk factors, prevalence, and future trends. Lancet. 2007;370:765–773. doi: 10.1016/S0140-6736(07)61380-4. - DOI - PubMed
    1. Caramori G, Kirkham P, Barczyk A, Di Stefano A, Adcock I. Molecular pathogenesis of cigarette smoking-induced stable COPD. Ann N Y Acad Sci. 2015;1340:55–64. doi: 10.1111/nyas.12619. - DOI - PubMed
    1. Barker BL, Brightling CE. Phenotyping the heterogeneity of chronic obstructive pulmonary disease. Clin Sci (Lond) 2013;124:371–387. doi: 10.1042/CS20120340. - DOI - PubMed
    1. Pike, D. et al. Regional Heterogeneity of Chronic Obstructive Pulmonary Disease Phenotypes: Pulmonary He Magnetic Resonance Imaging and Computed Tomography. COPD 1–9 (2016). - PubMed

Publication types

MeSH terms