. 2017 Jun 7;7(1):2980.
doi: 10.1038/s41598-017-03354-z.

Splice variants as novel targets in pancreatic ductal adenocarcinoma

Affiliations

Splice variants as novel targets in pancreatic ductal adenocarcinoma

Jun Wang et al. Sci Rep. .

Abstract

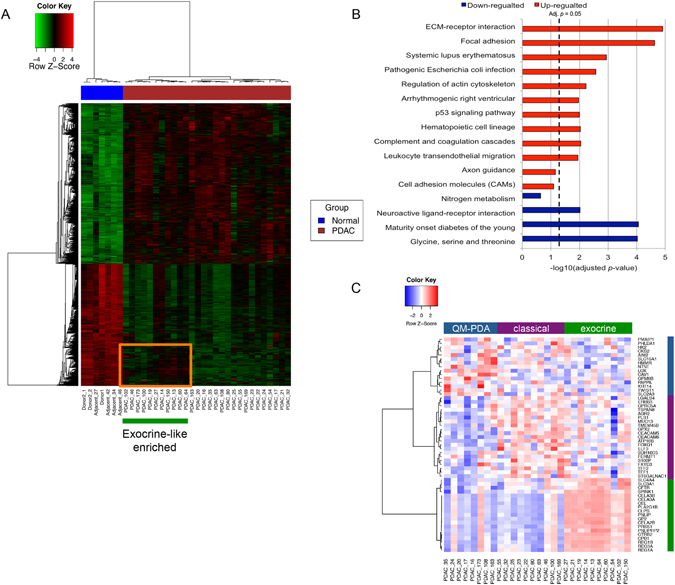
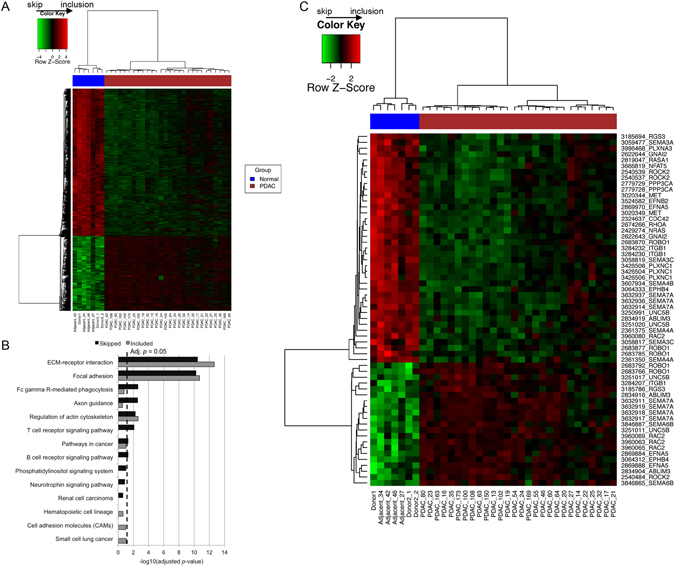
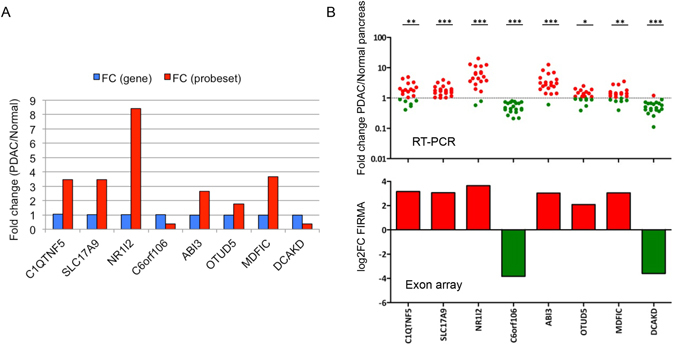
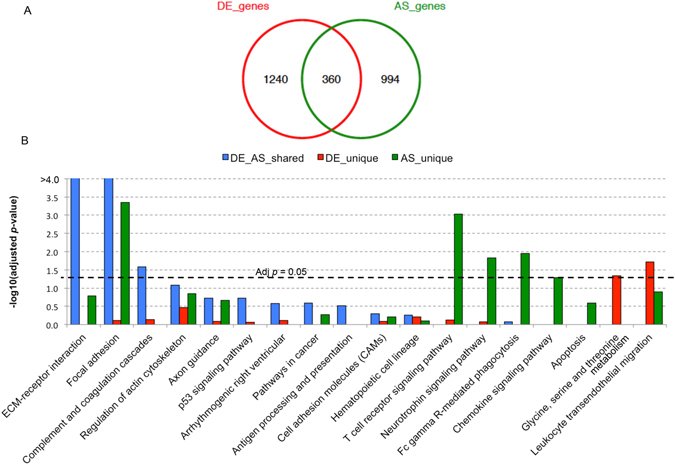
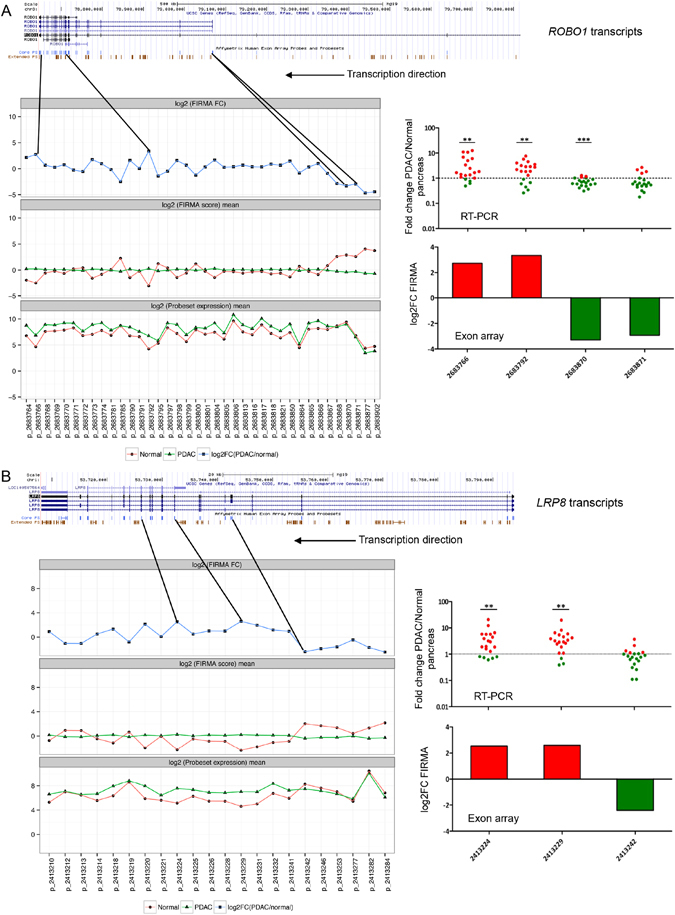
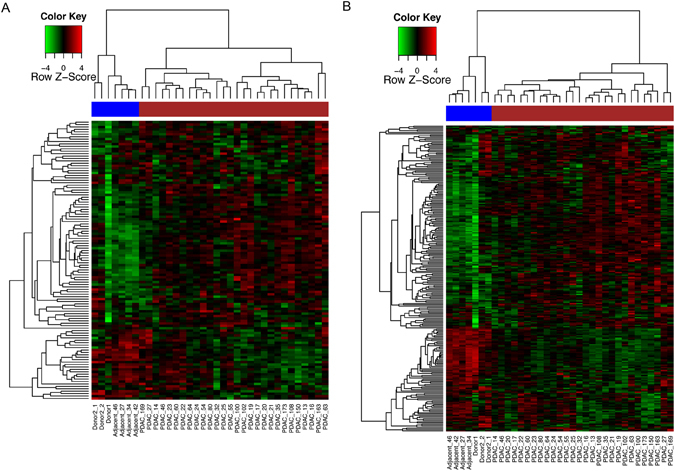
Despite a wealth of genomic information, a comprehensive alternative splicing (AS) analysis of pancreatic ductal adenocarcinoma (PDAC) has not been performed yet. In the present study, we assessed whole exome-based transcriptome and AS profiles of 43 pancreas tissues using Affymetrix exon array. The AS analysis of PDAC indicated on average two AS probe-sets (ranging from 1-28) in 1,354 significantly identified protein-coding genes, with skipped exon and alternative first exon being the most frequently utilised. In addition to overrepresented extracellular matrix (ECM)-receptor interaction and focal adhesion that were also seen in transcriptome differential expression (DE) analysis, Fc gamma receptor-mediated phagocytosis and axon guidance AS genes were also highly represented. Of note, the highest numbers of AS probe-sets were found in collagen genes, which encode the characteristically abundant stroma seen in PDAC. We also describe a set of 37 'hypersensitive' genes which were frequently targeted by somatic mutations, copy number alterations, DE and AS, indicating their propensity for multidimensional regulation. We provide the most comprehensive overview of the AS landscape in PDAC with underlying changes in the spliceosomal machinery. We also collate a set of AS and DE genes encoding cell surface proteins, which present promising diagnostic and therapeutic targets in PDAC.


Conflict of interest statement

The authors declare that they have no competing interests.

Figures

Figure 1
Figure 1
Differentially expressed protein-coding genes in PDAC. (A) Heatmap of the 1,887 differentially expressed transcript clusters in PDAC. The heatmap represents relative over- (red) and under-expressed (green) genes. The covariates at the top represent tumour (red) and normal (blue) samples. A subgroup of 11 PDAC samples is indicated by the orange box, determined by the exocrine-like gene signature by Collisson et al. with higher expression in a cluster of 255 transcripts than other PDAC samples. (B) KEGG pathway enrichment test for significantly up- and down-regulated genes in PDAC. The BH adjusted p-values were used (x-axis). (C) Heatmap and sample clustering based on the Collisson signature dividing samples into three molecular subtypes.
Figure 2
Figure 2
Alternative splicing in PDAC. (A) Heatmap of the 2,816 alternatively spliced probe-sets based on the FIRMA scores, with the relative inclusion shown in red and skipping shown in green. (B) KEGG pathway enrichment test for genes with included and skipped events. (C) Heatmap of 60 alternatively spliced probe-sets, representing 26 genes involved in axon guidance (KEGG). The row names are shown in the format of “probe-set” then followed by “gene symbol”.
Figure 3
Figure 3
Real-time PCR validation of exon array data. (A) Selection of 8 splicing probe-sets from non-differentially expressed genes. For these 8 genes/probe-sets, there were no differences in the level of gene expression, but significant differences in the level of probe-set expression. (B) RT-PCR results of the 8 probe-sets. RT-PCR results are represented as scatter dot plots of expression fold change in PDAC compared to normal pancreas, with the significance level shown at the top (* < 0.05, ** < 0.01, *** < 0.001). Corresponding exon array results are reported in histograms of log2 FIRMA fold change (PDAC/normal) values. The two sets of results corresponded well with each other very well.
Figure 4
Figure 4
Comparison between DE and AS genes. (A) The overlapping patterns between differentially expressed (DE) genes and alternatively spliced (AS) genes. (B) The KEGG pathway enrichment for unique DE genes (red), unique AS genes (green) and genes with both DE and AS signatures (blue). The –log10 (adjusted p-values) is shown at the y-axis.
Figure 5
Figure 5
Analysis of multiple splicing events for ROBO1 and LRP8, and validation with RT-PCR. (A) Alternative splicing for ROBO1. (B) Alternative splicing for LRP8. The UCSC transcripts are shown at the top. For all quantified core probe-sets, means for probe-set expression and FIRMA values (log2 scaled), and the log2 FIRMA fold changes (PDAC/normal) were shown underneath UCSC transcripts. The probe-sets chosen for RT-PCR validation were shown with the black solid lines, with their positions within the transcripts indicated. RT-PCR results for the chosen probe-sets are represented as scatter dot plots of expression fold change in PDAC compared to normal pancreas, with the significance level shown at the top (* < 0.05, ** < 0.01, *** < 0.001). Corresponding exon array results are also reported in histograms of log2 FIRMA fold change (PDAC/normal) values. Both ROBO1 and LRP8 are coding for cell-surface proteins, and both were transcribed in the reverse strand.
Figure 6
Figure 6
Heatmap showing the expression profiles of 119 (A) and 238 (B) spliceosomal genes, with the upregulated genes shown in red and downregulated in green. PDAC samples were indicated with the brown bar, while normal samples were indicated with the blue bar.

References

    1. Keren H, Lev-Maor G, Ast G. Alternative splicing and evolution: diversification, exon definition and function. Nat Rev Genet. 2010;11:345–355. doi: 10.1038/nrg2776. - DOI - PubMed
    1. Skotheim RI, Nees M. Alternative splicing in cancer: noise, functional, or systematic? Int J Biochem Cell Biol. 2007;39:1432–1449. doi: 10.1016/j.biocel.2007.02.016. - DOI - PubMed
    1. Pan Q, Shai O, Lee LJ, Frey BJ, Blencowe BJ. Deep surveying of alternative splicing complexity in the human transcriptome by high-throughput sequencing. Nat Genet. 2008;40:1413–1415. doi: 10.1038/ng.259. - DOI - PubMed
    1. Wang ET, et al. Alternative isoform regulation in human tissue transcriptomes. Nature. 2008;456:470–476. doi: 10.1038/nature07509. - DOI - PMC - PubMed
    1. Sveen A, Kilpinen S, Ruusulehto A, Lothe RA, Skotheim RI. Aberrant RNA splicing in cancer; expression changes and driver mutations of splicing factor genes. Oncogene. 2016;35:2413–2427. doi: 10.1038/onc.2015.318. - DOI - PubMed

Publication types

LinkOut - more resources