. 2017 Jun 7;7(1):2926.
doi: 10.1038/s41598-017-02836-4.

The lateral distance between a proton pump and ATP synthase determines the ATP-synthesis rate

Affiliations

The lateral distance between a proton pump and ATP synthase determines the ATP-synthesis rate

Johannes Sjöholm et al. Sci Rep. .

Abstract

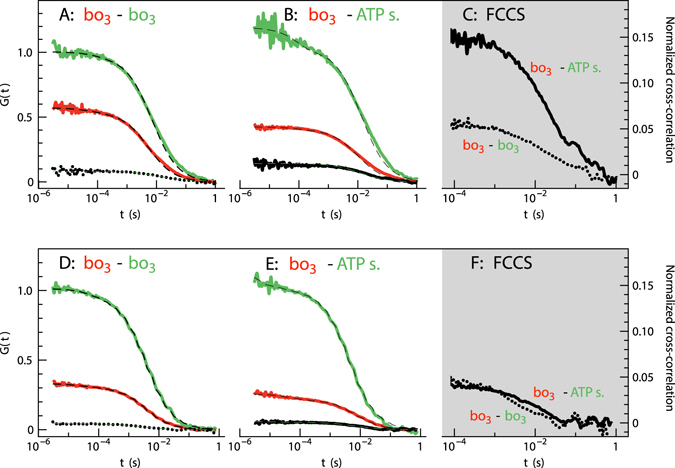
We have investigated the effect of lipid composition on interactions between cytochrome bo 3 and ATP-synthase, and the ATP-synthesis activity driven by proton pumping. The two proteins were labeled by fluorescent probes and co-reconstituted in large (d ≅ 100 nm) or giant (d ≅ 10 µm) unilamellar lipid vesicles. Interactions were investigated using fluorescence correlation/cross-correlation spectroscopy and the activity was determined by measuring ATP production, driven by electron-proton transfer, as a function of time. We found that conditions that promoted direct interactions between the two proteins in the membrane (higher fraction DOPC lipids or labeling by hydrophobic molecules) correlated with an increased activity. These data indicate that the ATP-synthesis rate increases with decreasing distance between cytochrome bo 3 and the ATP-synthase, and involves proton transfer along the membrane surface. The maximum distance for lateral proton transfer along the surface was found to be ~80 nm.


Conflict of interest statement

The authors declare that they have no competing interests.

Figures

Figure 1
Figure 1
The experimental system. Cyt. bo 3 and ATP-synthase from E. coli were co-reconstituted in vesicles (a part of the membrane is shown). For measurements of protein-protein interactions, cyt. bo 3 and ATP-synthase were labeled with fluorophores (not shwon, see text). To measure the coupled activity, DTT and quinone were added, which initiates transmembrane proton transfer, driven by the quinol oxidase. The ATP-synthesis rate was monitored by measuring changes in luminescence that originates from added luciferase/luciferin. Proton transfer along the membrane surface is discussed in the Discussion section.
Figure 2
Figure 2
Confocal scanning microscope images of a GUV in which two fluorophore-labeled proteins were reconstituted. (A) Detection of cyt. bo 3 labeled with ATTO 647N. The focal plane is at the middle of the vesicle. (B) Detection of ATP-synthase labeled with ATTO 594. (C) Combined image of ATTO 594 and ATTO 647N detection. (D) An image of the top of the vesicle, which is the focal plane used for the FCS measurements. The lipid composition of the vesicle was 99% DOPC and 1% DPPE functionalized with a biotinyl head group. The GUVs were immobilized on a streptavidin-coated cover slide and the solution around the vesicle was 10 mM HEPES pH 7.4, supplemented with 10 mM NaCl and 100 mM glucose.
Figure 3
Figure 3
Auto-correlation data measured with GUVs containing co-reconstituted cyt. bo 3 and ATP synthase. GUVs were composed of either 99% DOPC (AC) or 94% DOPC and 5% DOPG (DF), with the addition of 1% DPPE functionalized with a biotinyl head group. Measurements were done at pH 7.4 in 10 mM HEPES supplemented with 10 mM NaCl and 100 mM glucose. (A,D) FCS was used to study samples where cyt. bo 3 was labeled with either ATTO 647N (red trace) or ATTO 594 (green trace). (B,E) samples with cyt. bo 3 labeled with ATTO 647N and ATP-synthase labeled with ATTO 594. The dashed lines represent best fits of the data using a single component with planar two-dimensional diffusion and a triplet state fraction. The amplitude of the diffusional component obtained from the fit of the data with the ATTO 594-labeled protein has been set to unity (amplitude at ~10−4 s) to facilitate comparison of the traces. The autocorrelation function for FCCS was calculated in all cases and the normalized cross correlation amplitudes are compared in panels (C) and (F).
Figure 4
Figure 4
Diffusion coefficients determined from measurements of lateral diffusion of co-reconstituted proteins. (A) GUVs containing two populations of cyt. bo 3, each labeled with either ATTO 647N or ATTO 594. The lipid composition was 99% DOPC or 94% DOPC and 5% DOPG (DOPC:G), and in addition 1% DPPE functionalized with a biotinyl head group. (B) Cyt. bo 3 labeled with ATTO 647N and ATP-synthase labeled with ATTO 594. (C) Left: GUVs composed of DOPC with two populations of cyt. bo 3 labeled with either Abberior STAR 635 or ATTO 594 (bo 3-bo 3). Right: GUVs composed of DOPC with cyt. bo 3 labeled with Abberior STAR 635 and ATP-synthase labeled with ATTO 594 (bo 3-ATP s.). Schemes to the right illustrate the conditions of the experiments and the conclusions (see text for details); ATTO 647N promotes the binding between cyt. bo 3 and ATP synthase in DOPC membranes but not in DOPC:G membranes, reflected in the apparent diffusion constants of cyt. bo 3 (B). The effect is not observed with only cyt. bo 3 in the membrane (A) or when ATTO 647N is replaced by the more hydrophilic Abberior STAR 635 (C). Measurements were done at pH 7.4 in 10 mM HEPES supplemented with 10 mM NaCl and 100 mM glucose. Error bars represent standard deviation from measurements with five samples.
Figure 5
Figure 5
Summary of normalized cross correlation amplitudes measured with GUVs with co-reconstituted cyt. bo 3 and ATP synthase. (A) The normalized amplitudes were calculated from samples with cyt. bo 3 labeled with either ATTO 647 N or ATTO 594 (bo 3-bo 3), and cyt. bo 3 labeled with ATTO 647N and ATP-synthase labeled with ATTO 594 (bo 3-ATP s.). (B) Cyt. bo 3 was labeled with Abberior STAR 635. The lipid composition was either 99% DOPC (DOPC, blue) or 84–94% DOPC and 5–15% DOPG (DOPC:G, green), and in addition 1% DPPE functionalized with a biotinyl head group. Measurements were done at pH 7.4 in 10 mM HEPES supplemented with 10 mM NaCl and 100 mM glucose. Error bars represent standard deviation from measurements with five samples.
Figure 6
Figure 6
Coupled cyt. bo 3-ATP synthase activity. (A) ATP production by the ATP synthase, driven by an electrochemical gradient generated by cyt bo 3 (as shown in the scheme). ATP synthesis was measured as a change in luminescence from the luciferin-luciferase couple over 3 × 30 s. The reactions were started by the addition of ubiquinol Q1H2 (20 μM final concentration) in the presence of 2 mM DTT and 80 μM ADP. Measurements were done at pH 7.5 in 20 mM Tris-PO4 buffer supplemented with 2.5 mM MgCl2. Rates were calculated from the average slopes, calibrated by addition of well-defined amount of ATP (5 pmol, see mark at 30 s). The trace shown was obtained with 100 nm, 100% DOPC liposomes. (B) ATP-synthesis rates measured in DOPC vesicles with cyt. bo 3 labeled with either ATTO (A) 647N (and unlabeled ATP synthase) or Abberior STAR 635 (and ATP-synthase labeled with ATTO 594). Rates are compared to those obtained with proteoliposomes with unlabeled cyt. bo 3 and ATP-synthase in the presence (2.5 μM DDM, Detergent ctrl., see text for explanation) or absence (No label) of detergent. (C) Normalized ATP-synthesis rates of DOPC:DOPG vesicles with cyt. bo 3 and ATP-synthase labeled with ATTO 647N and ATTO 594 respectively (blue) or vesicles with unlabeled protein (green). The rates are normalized to that obtained with 100% DOPC vesicles to facilitate comparison. At 100% DOPC the activity was a factor of ~5 larger with the labeled than with the unlabeled proteins (c.f. panel B). Error bars is the standard deviation from measurements with four samples (except Detergent ctrl., two samples).
Figure 7
Figure 7
Calculated distance distribution of proteins in vesicles. Distance-probability distribution between cyt. bo 3 and ATP-synthase for the protein concentration in the ~10 μm GUVs (30 proteins/μm2) as well as for the 200 nm (80 proteins/μm2) and 100 nm (320 proteins/μm2) large unilamellar vesicles. The distance of highest probability (P max) is indicated in the figure. The probability distribution was obtained by calculating (see e.g. ref. 52) the probability of finding the nearest-neighbor to a particle in two dimensions for distances 0–300 nm.

Similar articles

Cited by

References

    1. Rich PR, Maréchal A. The mitochondrial respiratory chain. Essays in Biochemistry. 2010;47:1–23. doi: 10.1042/bse0470001. - DOI - PubMed
    1. Ädelroth P, Brzezinski P. Surface-mediated proton-transfer reactions in membrane-bound proteins. Biochim. Biophys. Acta. 2004;1655:102–115. doi: 10.1016/j.bbabio.2003.10.018. - DOI - PubMed
    1. Mulkidjanian AY, Heberle J, Cherepanov DA. Protons @ interfaces: Implications for biological energy conversion. Biochimica et Biophysica Acta - Bioenergetics. 2006;1757:913–930. doi: 10.1016/j.bbabio.2006.02.015. - DOI - PubMed
    1. Gutman M, Nachliel E. The Dynamics of Proton-Exchange between Bulk and Surface Groups. Biochim Biophys Acta. 1995;1231:123–138. doi: 10.1016/0005-2728(95)00074-S. - DOI
    1. Heberle J, Riesle J, Thiedemann G, Oesterhelt D, Dencher NA. Proton Migration Alone the Membrane-Surface and Retarded Surface to Bulk Transfer. Nature. 1994;370:379–382. doi: 10.1038/370379a0. - DOI - PubMed

Publication types

MeSH terms