. 2017:2017:9312142.
doi: 10.1155/2017/9312142. Epub 2017 May 16.

High Expression of Galectin-3 in Patients with IgG4-Related Disease: A Proteomic Approach

Affiliations

High Expression of Galectin-3 in Patients with IgG4-Related Disease: A Proteomic Approach

Adeeb Salah et al. Patholog Res Int. 2017.

Abstract

Objectives: Immunoglobulin G4-related disease (IgG4-RD) is a multiorgan condition manifesting itself in different forms. This study aimed to investigate protein expression profiles and to find the possible biomarker for IgG4-RD by liquid chromatography mass spectrometry (LC-MS) using tissue sections in IgG4-RD patients.

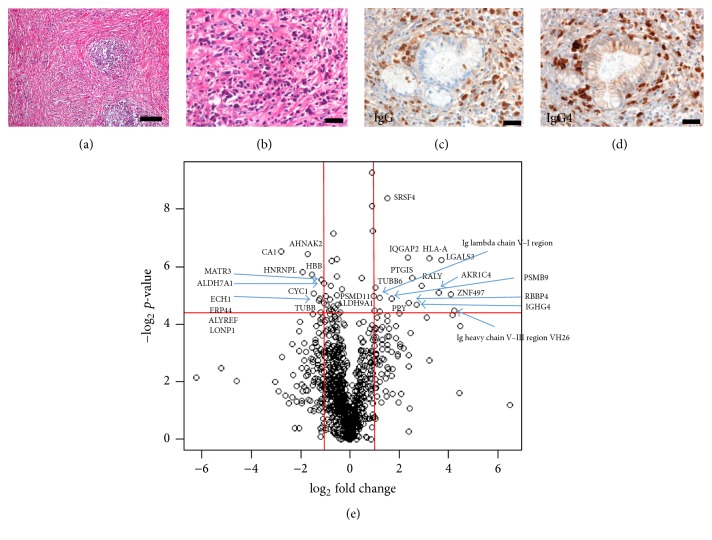
Methods: Protein expression profiles in five IgG4-related pancreatitis and three normal pancreatic samples were compared using LC-MS and were validated by quantitative real-time PCR (qRT-PCR), immunoblotting, and immunohistochemistry. ELISA was employed in the serum of 20 patients with systemic IgG4-RD before and during steroid treatment.

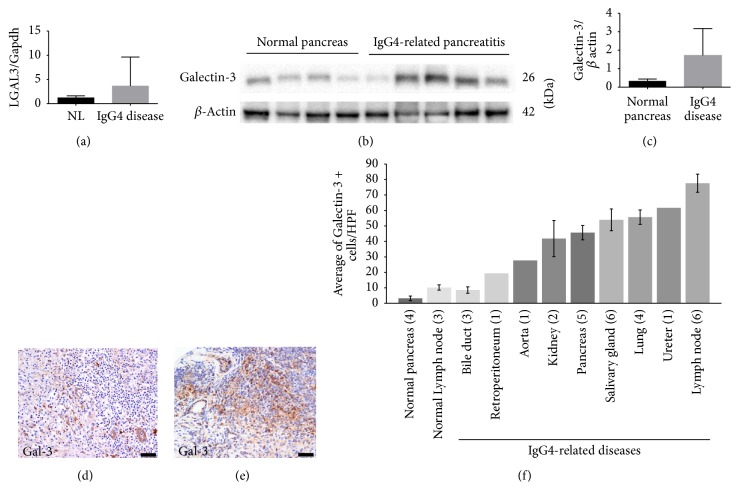
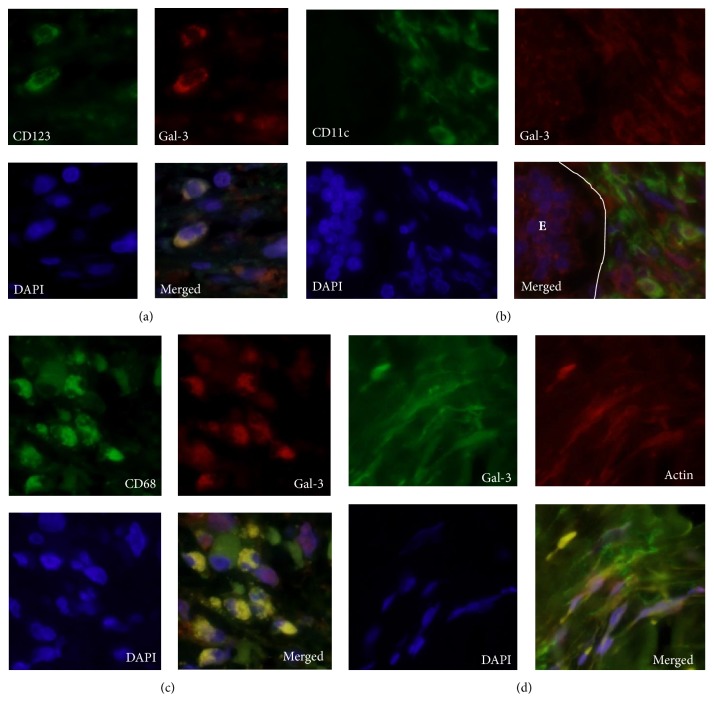
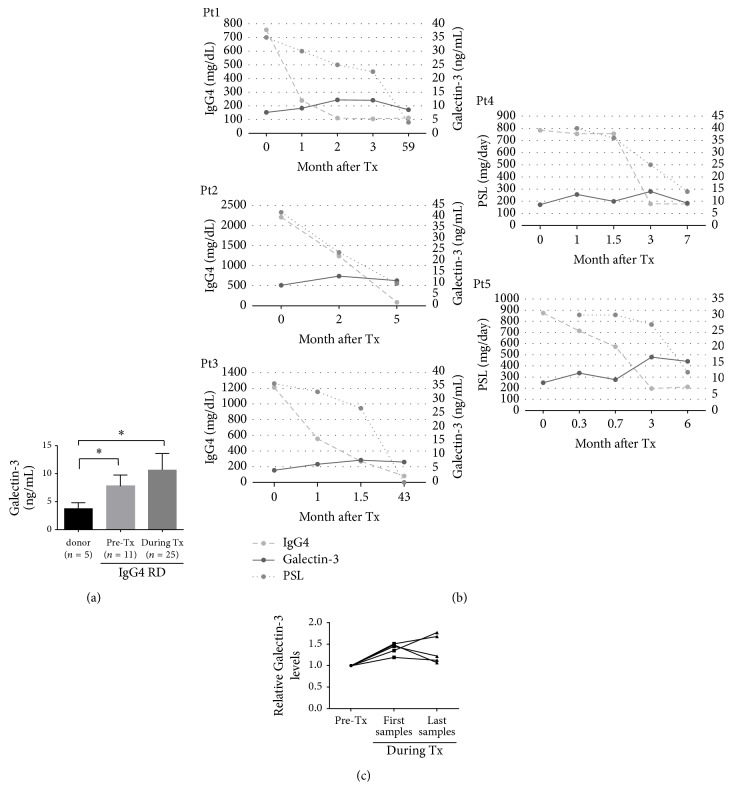
Results: LC-MS indicated that the levels of 17 proteins were significantly higher and 12 others were significantly lower in IgG4-related pancreatitis patients compared to controls. Among these proteins, galectin-3 levels were 13-fold higher in IgG4-related pancreatitis (P < 0.01). These results were confirmed by immunoblotting and qRT-PCR. The average number of galectin-3 + cells in various organs of IgG4-RD patients, including salivary glands, lungs, and lymph nodes, was higher than in controls. Galectin-3 was detectable in macrophages, dendritic cells, and stromal myofibroblast-like cells, but not in lymphocytes by immunofluorescence staining. Serum galectin-3 levels were higher in patients with IgG4-RD compared with healthy donors and remained high during steroid therapy.

Conclusion: Galectin-3 was overexpressed in IgG4-RD and the levels were indirectly related to clinical activity.


Figures

Figure 1
Figure 1
Histologic features of IgG4-related disease (IgG4-RD) and liquid chromatography mass spectrometry (LS-MS) analysis. ((a) to (d)) Pancreatic tissue from patients with IgG4-related pancreatitis. (a) Fibrosis and aggregates of lymphocytes. Hematoxylin and eosin staining, scale bar, 100 μm. (b) Plasma cell infiltration as one of the histological features of IgG4-RD, Hematoxylin and eosins staining, scale bar, 20 μm. (c) Immunostaining with anti-IgG antibodies; or (d) with anti-IgG4 antibodies staining. IgG4/IgG > 90%, scale bar, 20 μm. IgG4 staining is one of the diagnostic criteria of IgG4-RD. (e) Volcano plot of all differential proteins showing a different abundance in IgG4-related pancreatitis (n = 5) compared to the healthy pancreas (n = 3) samples in our LC-MS analysis. Horizontal axis represents fold change compared to the respective protein in control samples. Vertical axis represents P values. Proteins with a 2-fold change in their levels and a P value lower that 0.05 were considered significant hits. Fold change values indicate higher (+) or lower (−) expression in IgG4-related pancreatitis samples compared with the controls. Significant proteins are labeled with their gene name in the figure.
Figure 2
Figure 2
Validation of galectin-3 expression in patients' tissues. (a) LGALS-3 expression was higher in IgG4-related pancreatitis patients compared to controls. Data are presented as the mean relative expression ratio between the mRNA levels of the LGALS3 gene and the expression of GAPDH. Error bars, standard error of the mean (SEM). (b) Immunoblot analysis showing higher galectin-3 protein levels in IgG4-related pancreatitis samples (n = 5) compared with those in the normal pancreas samples (n = 4). (c) Quantification of the immunoblot presented in panel (b). Mean band intensity ratio was measured as intensity of galectin-3 band divided by the intensity of the corresponding beta actin band. Bar graphs represent mean values. Error bars, SEM. (d, e) Immunolocalization of galectin-3 in IgG4-RD samples ((d) pancreas; (e) submandibular gland). Note that lymphoid cells in (d) were negative for galectin-3. Scale bar, 20 μm. (f) Average galectin-3 positive cells in the stroma in different organs in IgG4-RD patients. Positive cells were counted in 3HPF. Numbers in parentheses represent the number of cases. Bar graphs represent mean values. Error bars, SEM.
Figure 3
Figure 3
Immunofluorescent localization galectin-3 in immune and stromal cells of IgG4-RD patients. (a) Immunofluorescent localization of CD123 (green) and galectin 3 (red) in IgG4-RD samples, showing galectin-3 expression in plasmacytoid dendritic cells. (b) Immunofluorescent localization of CD11c (green) and galectin 3 (red) in IgG4-RD samples, showing galectin-3 expression on myeloid dendritic cells. Note the epithelial cells in the duct, on the left (E), positive for galectin-3. (c) CD68 (green) and galectin-3 (red) in IgG4-RD samples, showing galectin-3 expression on macrophages. (d) Galectin-3 (green) and α-smooth muscle actin (red) localization in IgG4-RD samples. Stromal spindle cells were positive for galectin-3, suggesting galectin-3 expression in myofibroblasts. Note the galectin-3 deposition in the stroma. In all experiments, nuclei were stained with DAPI (blue) and images were taken at a magnification of 600x. Gal-3, Galectin-3.
Figure 4
Figure 4
IgG4 and galectin-3 levels in serum after steroid treatment. (a) ELISA assay indicates that galectin-3 levels in serum in patients with IgG4-RD were 2- and 2.5-fold higher, before and after steroid treatment, respectively, compared to the normal control (P < 0.05). Error bars, standard error of the mean (SEM). Tx, treatment. (b) Changes in IgG4 and galectin-3 levels in serum of five IgG4-RD patients before and during steroid treatment. (c) Galectin-3 levels in serum in five steroid-treated IgG4-RD patients. Galectin-3 levels were 1.39-fold higher immediately after the start of the treatment (mean 1 month) and 1.37-fold higher at the last follow-up treatment after 24 months on average, compared to the pretreatment levels.

Similar articles

Cited by

References

    1. Kamisawa T., Funata N., Hayashi Y., et al. A new clinicopathological entity of IgG4-related autoimmune disease. Journal of Gastroenterology. 2003;38(10):982–984. doi: 10.1007/s00535-003-1175-y. - DOI - PubMed
    1. Stone J. H., Zen Y., Deshpande V. Mechanisms of disease: IgG4-related disease. The New England Journal of Medicine. 2012;366(6):539–551. doi: 10.1056/NEJMra1104650. - DOI - PubMed
    1. Kolfschoten M. V. D. N., Schuurman J., Losen M., et al. Anti-inflammatory activity of human IgG4 antibodies by dynamic Fab arm exchange. Science. 2007;317(5844):1554–1557. doi: 10.1126/science.1144603. - DOI - PubMed
    1. Aalberse R. C., Stapel S. O., Schuurman J., Rispens T. Immunoglobulin G4: an odd antibody. Clinical and Experimental Allergy. 2009;39(4):469–477. doi: 10.1111/j.1365-2222.2009.03207.x. - DOI - PubMed
    1. Punnonen J., Aversa G., Cocks B. G., et al. Interleukin 13 induces interleukin 4-independent IgG4 and IgE synthesis and CD23 expression by human B cells. Proceedings of the National Academy of Sciences of the United States of America. 1993;90(8):3730–3734. doi: 10.1073/pnas.90.8.3730. - DOI - PMC - PubMed

LinkOut - more resources