Biphasic Metabolism and Host Interaction of a Chlamydial Symbiont
- PMID: 28593198
- PMCID: PMC5451489
- DOI: 10.1128/mSystems.00202-16
Biphasic Metabolism and Host Interaction of a Chlamydial Symbiont
Abstract
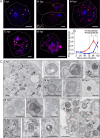
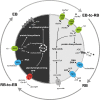
Chlamydiae are obligate intracellular bacteria comprising well-known human pathogens and ubiquitous symbionts of protists, which are characterized by a unique developmental cycle. Here we comprehensively analyzed gene expression dynamics of Protochlamydia amoebophila during infection of its Acanthamoeba host by RNA sequencing. This revealed a highly dynamic transcriptional landscape, where major transcriptional shifts are conserved among chlamydial symbionts and pathogens. Our data served to propose a time-resolved model for type III protein secretion during the developmental cycle, and we provide evidence for a biphasic metabolism of P. amoebophila during infection, which involves energy parasitism and amino acids as the carbon source during initial stages and a postreplicative switch to endogenous glucose-based ATP production. This fits well with major transcriptional changes in the amoeba host, where upregulation of complex sugar breakdown precedes the P. amoebophila metabolic switch. The biphasic chlamydial metabolism represents a unique adaptation to exploit eukaryotic host cells, which likely contributed to the evolutionary success of this group of microbes. IMPORTANCE Chlamydiae are known as major bacterial pathogens of humans, causing the ancient disease trachoma, but they are also frequently found in the environment where they infect ubiquitous protists such as amoebae. All known chlamydiae require a eukaryotic host cell to thrive. Using the environmental chlamydia Protochlamydia amoebophila within its natural host, Acanthamoeba castellanii, we investigated gene expression dynamics in vivo and throughout the complete chlamydial developmental cycle for the first time. This allowed us to infer how a major virulence mechanism, the type III secretion system, is regulated and employed, and we show that the physiology of chlamydiae undergoes a complete shift regarding carbon metabolism and energy generation. This study provides comprehensive insights into the infection strategy of chlamydiae and reveals a unique adaptation to life within a eukaryotic host cell.
Keywords: Protochlamydia; RNA-seq; chlamydia; developmental cycle; gene expression; host-microbe interaction; metabolism; symbiont; type III secretion system.
Figures


Similar articles
-
Metabolic features of Protochlamydia amoebophila elementary bodies--a link between activity and infectivity in Chlamydiae.PLoS Pathog. 2013;9(8):e1003553. doi: 10.1371/journal.ppat.1003553. Epub 2013 Aug 8. PLoS Pathog. 2013. PMID: 23950718 Free PMC article.
-
Inclusion membrane proteins of Protochlamydia amoebophila UWE25 reveal a conserved mechanism for host cell interaction among the Chlamydiae.J Bacteriol. 2010 Oct;192(19):5093-102. doi: 10.1128/JB.00605-10. Epub 2010 Jul 30. J Bacteriol. 2010. PMID: 20675479 Free PMC article.
-
Symbiont-Mediated Defense against Legionella pneumophila in Amoebae.mBio. 2019 May 14;10(3):e00333-19. doi: 10.1128/mBio.00333-19. mBio. 2019. PMID: 31088922 Free PMC article.
-
Chlamydial metabolism revisited: interspecies metabolic variability and developmental stage-specific physiologic activities.FEMS Microbiol Rev. 2014 Jul;38(4):779-801. doi: 10.1111/1574-6976.12059. Epub 2014 Feb 24. FEMS Microbiol Rev. 2014. PMID: 24484402 Free PMC article. Review.
-
Chlamydiae in the Environment.Trends Microbiol. 2020 Nov;28(11):877-888. doi: 10.1016/j.tim.2020.05.020. Epub 2020 Jun 23. Trends Microbiol. 2020. PMID: 32591108 Review.
Cited by
-
Comprehensive Flux Modeling of Chlamydia trachomatis Proteome and qRT-PCR Data Indicate Biphasic Metabolic Differences Between Elementary Bodies and Reticulate Bodies During Infection.Front Microbiol. 2019 Oct 15;10:2350. doi: 10.3389/fmicb.2019.02350. eCollection 2019. Front Microbiol. 2019. PMID: 31681215 Free PMC article.
-
Impact of Active Metabolism on Chlamydia trachomatis Elementary Body Transcript Profile and Infectivity.J Bacteriol. 2018 Jun 25;200(14):e00065-18. doi: 10.1128/JB.00065-18. Print 2018 Jul 15. J Bacteriol. 2018. PMID: 29735758 Free PMC article.
-
Chlamydia trachomatis Growth and Cytokine mRNA Response in a Prostate Cancer Cell Line.Adv Urol. 2019 Jan 17;2019:6287057. doi: 10.1155/2019/6287057. eCollection 2019. Adv Urol. 2019. PMID: 30800160 Free PMC article.
-
Anaerobic Sulfur Oxidation Underlies Adaptation of a Chemosynthetic Symbiont to Oxic-Anoxic Interfaces.mSystems. 2021 Jun 29;6(3):e0118620. doi: 10.1128/mSystems.01186-20. Epub 2021 May 26. mSystems. 2021. PMID: 34058098 Free PMC article.
-
Spontaneous Aberrant Bodies Formation in Human Pneumocytes Infected with Estrella lausannensis.Microorganisms. 2023 Sep 22;11(10):2368. doi: 10.3390/microorganisms11102368. Microorganisms. 2023. PMID: 37894026 Free PMC article.
References
-
- Kuo C-C, Stephens RS. 2015. Chlamydiaceae. In Whitman WB, Rainey F, Kämpfer P, Trujillo M, Chun J, DeVos P, Hedlund B, Dedysh S (ed), Bergey’s manual of systematics of archaea and bacteria. John Wiley & Sons, Ltd, Chichester, United Kingdom.
-
- World Health Organization 2012. Global incidence and prevalence of selected curable sexually transmitted infections − 2008. World Health Organization, Geneva, Switzerland.
Grants and funding
LinkOut - more resources
Full Text Sources
Other Literature Sources
Molecular Biology Databases
