

Review
doi: 10.1007/s10554-017-1179-y.
Epub 2017 Jun 7.
MRI use for atrial tissue characterization in arrhythmias and for EP procedure guidance
Affiliations
- PMID: 28593399
- PMCID: PMC5889521
- DOI: 10.1007/s10554-017-1179-y
Item in Clipboard
Review
MRI use for atrial tissue characterization in arrhythmias and for EP procedure guidance
Int J Cardiovasc Imaging.
2018 Jan.
Abstract
We review the utilization of magnetic resonance imaging methods for classifying atrial tissue properties that act as a substrate for common cardiac arrhythmias, such as atrial fibrillation. We then review state-of-the-art methods for mapping this substrate as a predicate for treatment, as well as methods used to ablate the electrical pathways that cause arrhythmia and restore patients to sinus rhythm.
Keywords: Atrial fibrillation; MRI; Radio-frequency ablation.
Figures
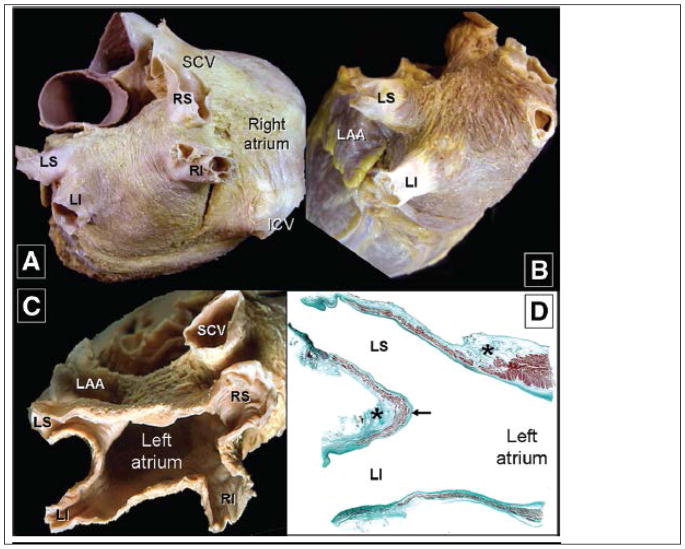
Anatomic views of the Left atrium from a heart in which the epicardium has been removed. Parts A–C show classic views of the left atrium and the associated pulmonary veins. Part D, a stained thin section, shows the muscle sleeves entering the pulmonary veins, with the stars showing location of nerves in the surrounding fat-pads. (After Ho S.Y. et al. Circulation Arrhythmia & Electrophysiology 2012, with permission)
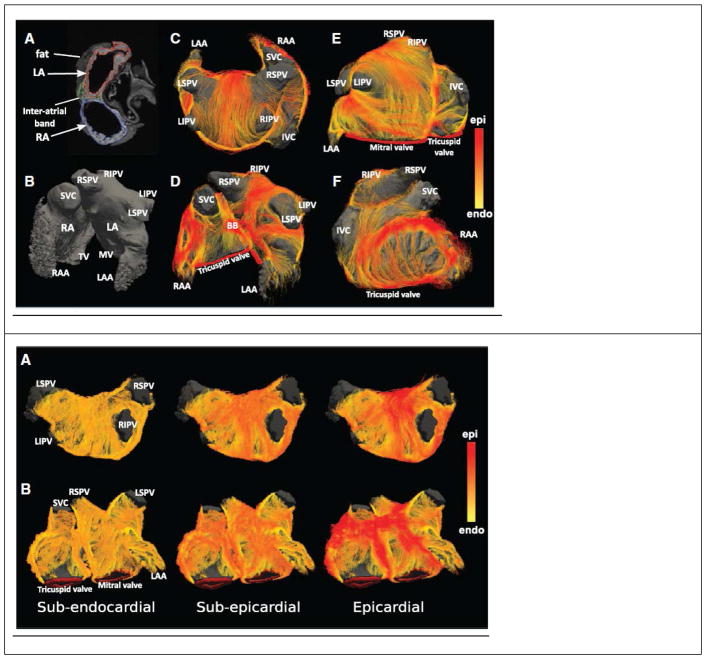
Fiber tractography of normal human atria, obtained from diffusion-weighted MRI imaging of ex-vivo samples. (Top) Atrial geometry. Left column (A, B) shows standard T1-weighted MRI images of the anatomy. Middle column (C, D) External surface view of the fiber tracts. Right column (E, F) anterior view of atrium. (Bottom) Changes in fiber tract orientation with depth in the left atrial wall of a single subject. Color code on right measures the similarity to the fiber tract direction on the epicardial surface. (After Pashakhanloo F et al., Circulation Arrhythmia & Electrophysiology 2016, with permission )
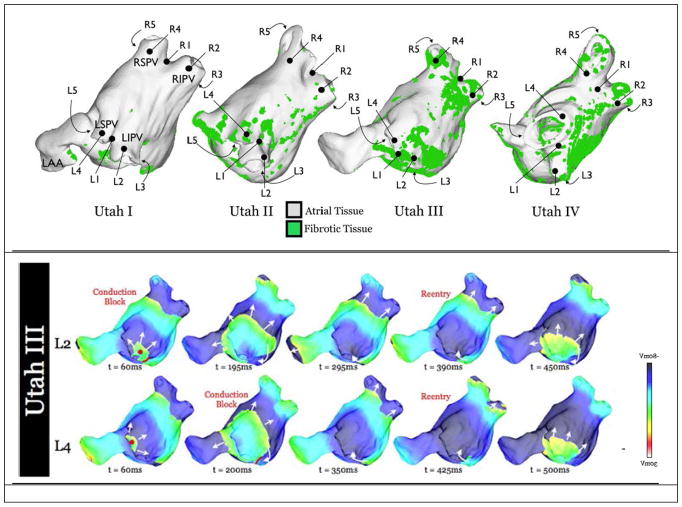
Distribution of Fibrotic tissue, as observed with navigated LGE MRI imaging. Top: The University of Utah group headed by Dr. N. Marouche, has separated AF patients into groups termed Utah I-Utah IV, according to the distribution of fibrotic tissue in the atrium. Different density and distribution of fibrotic tissue can sustain different forms of fibrillatory rotors. Bottom: Examples of propagation of electrical fibrillatory waves from two different foci (L2, L4) in the PV-atrium junction for a Utah III type patient. (After McDowell K.S. et al. Plos 1 2015, with permission)
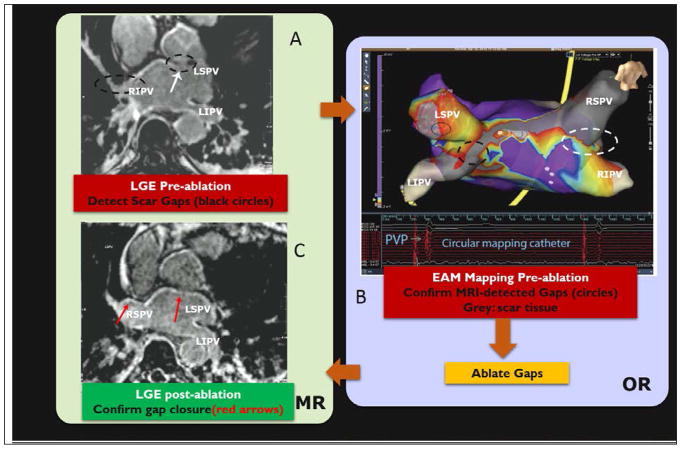
Human procedure for repair of atrial fibrillation recurrence. Procedure involved (A) imaging the patient with LGE and MRA in an MRI prior to the intervention, in order to detect gaps in ablation lesions in the left atrium [lack of hyper-intense signal on the atrial wall], (B) patient transfer to a conventional EP lab where the MRI images were registered to a commercial Electro-anatomic (EAM) map and then the gaps were confirmed by navigating catheters to these locations, measuring wall voltages to establish that the MRI-seen gaps were actually there, and ablating the gaps with RF, and (C) transfer of the patient back to the MRI suite for a post-operative LGE, which confirmed that the gaps were indeed closed. AF has not recurred in any of the 7 patients studied in this protocol. (After Michaud G. F. et al, Proceedings of Heart Rhythm society, 2012).
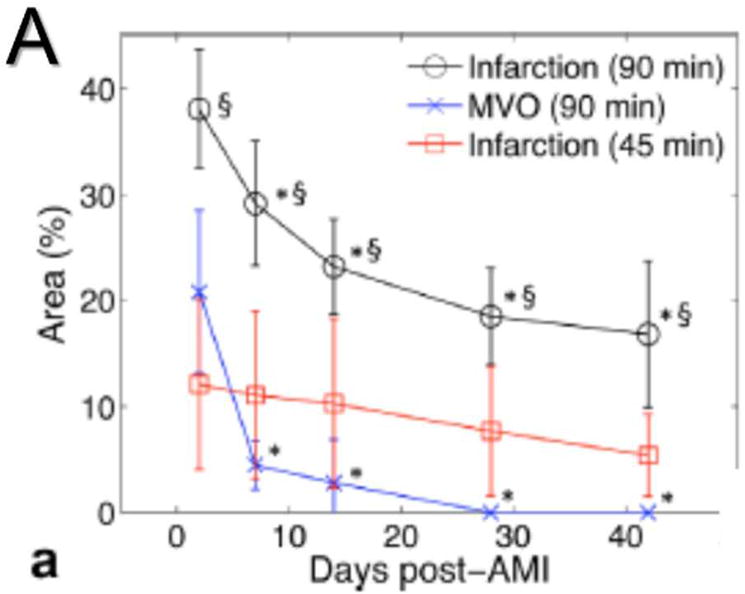
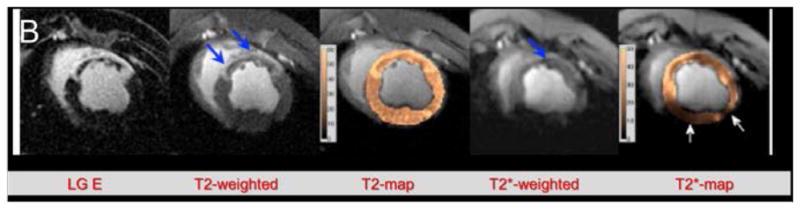
Changes in a left ventricular infarct over time, as seen with different sequences. Infarct was created by a 45- or 90-minute coronary occlusion. (A) Graph showing the reduction in size of the apparent infarct over time. Note that the true necrotic region (Infarction 45 min, in red) does not substantially decrease over time. (B) Several imaging sequences performed on a 90-minute occlusion infarct. LGE, T2-weighted, and T2 map show both the infarct core and the surrounding edema (thick blue arrows), while T2*-weighted image and T2* map show true infarct core as dark (thin blue arrow) region. (After Ghugre N. R. et al., Magn. Res. Med. 2013, with permission)
Changes in a left ventricular infarct over time, as seen with different sequences. Infarct was created by a 45- or 90-minute coronary occlusion. (A) Graph showing the reduction in size of the apparent infarct over time. Note that the true necrotic region (Infarction 45 min, in red) does not substantially decrease over time. (B) Several imaging sequences performed on a 90-minute occlusion infarct. LGE, T2-weighted, and T2 map show both the infarct core and the surrounding edema (thick blue arrows), while T2*-weighted image and T2* map show true infarct core as dark (thin blue arrow) region. (After Ghugre N. R. et al., Magn. Res. Med. 2013, with permission)
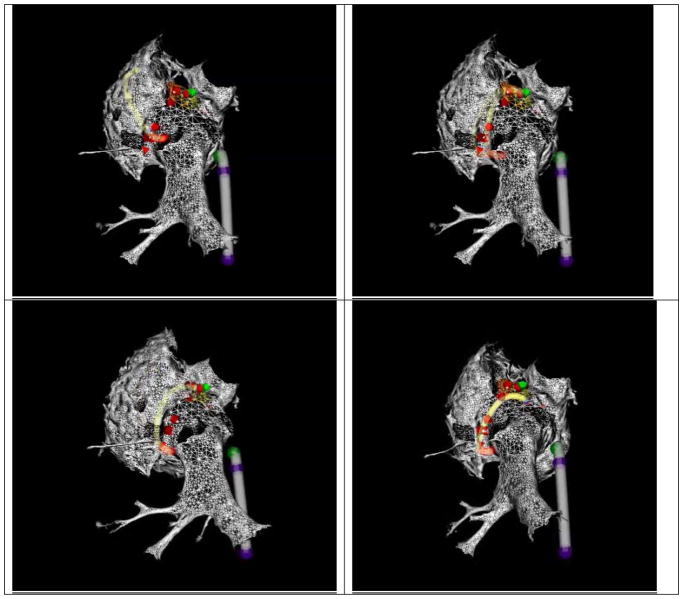
Four frames from a Radio-Frequency thermal ablation of a swine left atrium using MR-Tracking guidance. Two devices are tracked simultaneously; a deflectable sheath (grey shaft, blue tracked locations on shaft) and an ablation catheter (yellow shaft, red tracked locations on shaft). The atrial geometry was obtained from a navigated ECG-gated CE-MRA scan. The ablation catheter is ablating the left-atrial pulmonary-vein ostium in a point-by-point method, with the ablation points defined by red arrows. (After Schmidt E. J. et al., Circulation Arrhythmia and Electrophysiology 2009, with permission)
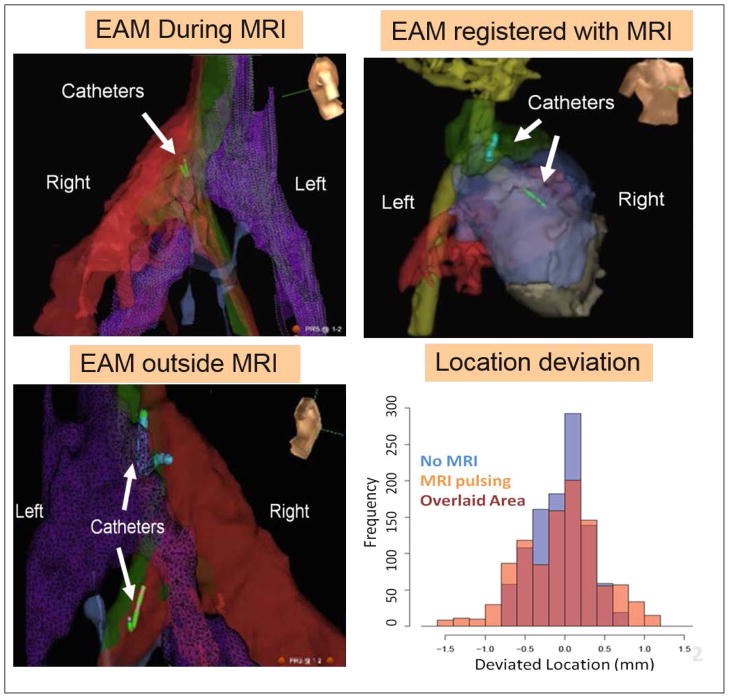
Voltage Device Tracking in a swine. Three VDT MRI-compatible catheter were simultaneously tracked. (A) Tracking and collecting Electro-Anatomic (EAM) maps inside the MRI. (B). VDT tracking can be transferred to the MRI frame of reference, if MRI anatomic images are acquired, displayed navigation on MRI roadmaps. (C) After the swine was moved out of the MRI, navigation was continued without requiring registration. (D) Graph showing the small difference in location between VDT tracking performed inside the MRI during (MRI pulsing) or in the absence of imaging (No MRI). (After Schmidt E.J. et al., Mag Res Med 2014, with permission)
References
-
- Calkins H, Brugada J, Packer DL, Cappato R, Chen SA, Crijns HJ, Damiano RJ, Jr, Davies DW, Haines DE, Haissaguerre M, Iesaka Y, Jackman W, Jais P, Kottkamp H, Kuck KH, Lindsay BD, Marchlinski FE, McCarthy PM, Mont JL, Morady F, Nademanee K, Natale A, Pappone C, Prystowsky E, Raviele A, Ruskin JN, Shemin RJ Heart Rhythm S, European Heart Rhythm A, European Cardiac Arrhythmia S, American College of C, American Heart A, Society of Thoracic S. Hrs/ehra/ecas expert consensus statement on catheter and surgical ablation of atrial fibrillation: Recommendations for personnel, policy, procedures and follow-up. A report of the heart rhythm society (hrs) task force on catheter and surgical ablation of atrial fibrillation developed in partnership with the european heart rhythm association (ehra) and the european cardiac arrhythmia society (ecas); in collaboration with the american college of cardiology (acc), american heart association (aha), and the society of thoracic surgeons (sts). Endorsed and approved by the governing bodies of the american college of cardiology, the american heart association, the european cardiac arrhythmia society, the european heart rhythm association, the society of thoracic surgeons, and the heart rhythm society. Europace : European pacing, arrhythmias, and cardiac electrophysiology : journal of the working groups on cardiac pacing, arrhythmias, and cardiac cellular electrophysiology of the European Society of Cardiology. 2007;9:335–379. - PubMed
-
- Colilla S, Crow A, Petkun W, Singer DE, Simon T, Liu X. Estimates of current and future incidence and prevalence of atrial fibrillation in the u.S. Adult population. The American journal of cardiology. 2013;112:1142–1147. - PubMed
-
- Rodriguez CJ, Soliman EZ, Alonso A, Swett K, Okin PM, Goff DC, Jr, Heckbert SR. Atrial fibrillation incidence and risk factors in relation to race-ethnicity and the population attributable fraction of atrial fibrillation risk factors: The multi-ethnic study of atherosclerosis. Annals of epidemiology. 2015;25:71–76. 76 e71. - PMC - PubMed
-
- Schnabel RB, Yin X, Gona P, Larson MG, Beiser AS, McManus DD, Newton-Cheh C, Lubitz SA, Magnani JW, Ellinor PT, Seshadri S, Wolf PA, Vasan RS, Benjamin EJ, Levy D. 50 year trends in atrial fibrillation prevalence, incidence, risk factors, and mortality in the framingham heart study: A cohort study. Lancet. 2015;386:154–162. - PMC - PubMed
-
- Kim MH, Johnston SS, Chu BC, Dalal MR, Schulman KL. Estimation of total incremental health care costs in patients with atrial fibrillation in the united states. Circulation. Cardiovascular quality and outcomes. 2011;4:313–320. - PubMed
Publication types
MeSH terms
Substances
Grants and funding
LinkOut - more resources
Full Text Sources
Other Literature Sources
Medical
