Review
. 2017 Jul;24(21):17285-17325.
doi: 10.1007/s11356-017-9240-x. Epub 2017 Jun 7.

The environmental risks of neonicotinoid pesticides: a review of the evidence post 2013

Affiliations
Review

The environmental risks of neonicotinoid pesticides: a review of the evidence post 2013

Thomas James Wood et al. Environ Sci Pollut Res Int. 2017 Jul.

Abstract

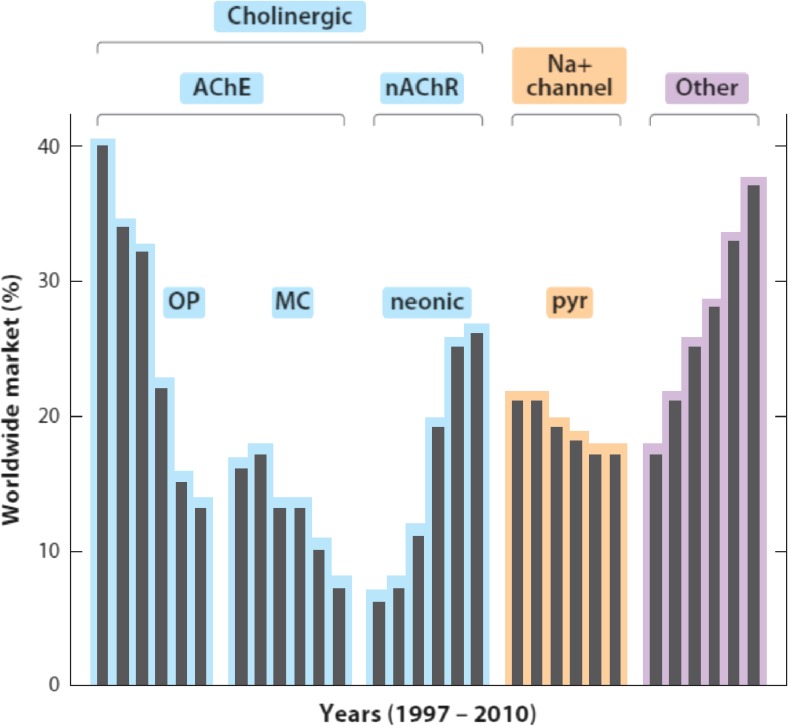
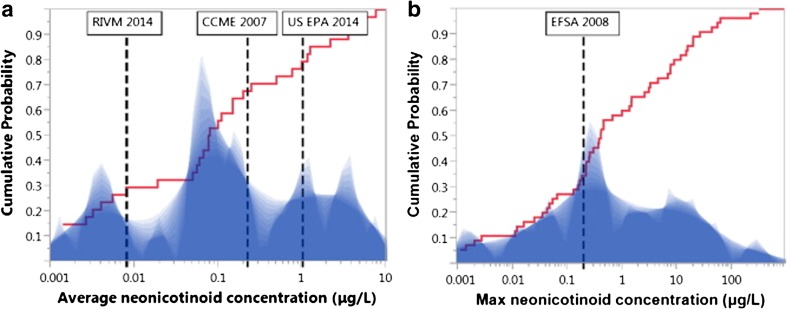
Neonicotinoid pesticides were first introduced in the mid-1990s, and since then, their use has grown rapidly. They are now the most widely used class of insecticides in the world, with the majority of applications coming from seed dressings. Neonicotinoids are water-soluble, and so can be taken up by a developing plant and can be found inside vascular tissues and foliage, providing protection against herbivorous insects. However, only approximately 5% of the neonicotinoid active ingredient is taken up by crop plants and most instead disperses into the wider environment. Since the mid-2000s, several studies raised concerns that neonicotinoids may be having a negative effect on non-target organisms, in particular on honeybees and bumblebees. In response to these studies, the European Food Safety Authority (EFSA) was commissioned to produce risk assessments for the use of clothianidin, imidacloprid and thiamethoxam and their impact on bees. These risk assessments concluded that the use of these compounds on certain flowering crops poses a high risk to bees. On the basis of these findings, the European Union adopted a partial ban on these substances in May 2013. The purpose of the present paper is to collate and summarise scientific evidence published since 2013 that investigates the impact of neonicotinoids on non-target organisms. Whilst much of the recent work has focused on the impact of neonicotinoids on bees, a growing body of evidence demonstrates that persistent, low levels of neonicotinoids can have negative impacts on a wide range of free-living organisms.

Keywords: Bees; European Food Safety Authority; Freshwater habitats; Invertebrates; Neonicotinoid pesticides; Neonicotinoids; Non-target organisms; Residues.


Figures

Fig. 1
Fig. 1
Changes in use of insecticide classes between 1997 and 2010 showing decreases for organophosphates (OPs), methylcarbamates (MCs) and pyrethroids (pyr) and increases for neonicotinoids (neonic) and other compounds. Abbreviations: AChE acetylcholinesterase; nAChR nicotinic acetylcholine receptor. Reproduced from Casida and Durkin (2013)
Fig. 2
Fig. 2
Number of studies published in scientific journals on neonicotinoids in each year. Open circles, “neonicotinoid*”; filled diamonds, “neonictotinoid* + bee*”; filled circle, “neonicotinoid* + residue”; open triangle, “neonicotinoid* + water”; filled triangle, “neonicotinoid* + soil”. Data from Web of Science
Fig. 3
Fig. 3
Elution profiles of clothianidin and thiamethoxam upon absorption on soils. Concentrations of clothianidin (black columns) and thiamethoxam (grey columns) measured in aqueous eluates from soil columns of a sand, b clay and c loam soils. Eluates from d pumice columns are shown as a control. Concentrations in 10-mL fractions of the eluate are shown in micrograms per millilitre, as a function of the fraction number. Reproduced from Mörtl et al. (2016)
Fig. 4
Fig. 4
Mean clothianidin soil concentrations from 2011 to 2013 for each maize seed-coating rate (0.25 vs 0.50 mg of clothianidin/seed). Maize planting is presented because it represents the introduction of clothianidin in the field, and tillage events are also presented. Asterisks represent significantly different concentrations between seed-coating treatments for one sampling event (t test, p ≤ 0.05, n = 13 and n = 17 for 0.25 and 0.50 mg/seed, respectively, from April 2011 to March 2013; n = 15 for both seed treatment rates since May 2013). Reproduced from de Perre et al. (2015). Note—untreated soybeans were sown in 2012
Fig. 5
Fig. 5
Shadow histogram of a average and b maximum individual neonicotinoid concentrations (log scale, μg/L) reported from water monitoring studies. Overlaid is the cumulative distribution probability (red ascending line) using all available surface water monitoring data showing proportion of data below any given neonicotinoid concentration. Vertical dashed lines illustrate multiple ecological quality reference values set for average imidacloprid water concentrations (RIVM , 0.0083 μg/L; CCME , 0.23 μg/L and US EPA , 1.05 μg/L) or for maximum imidacloprid water concentrations (EFSA , 0.2 μg/L). Reproduced from Morrissey et al.
Fig. 6
Fig. 6
Concentrations of clothianidin, imidacloprid and thiamethoxam and the corresponding stream discharge at three sites in the Chesapeake Bay area sampled in 2014. Black bars represent samples where no neonicotinoids were detected. Reproduced from Hladik and Kolpin (2016)
Fig. 7
Fig. 7
a Concentrations of imidacloprid and the corresponding stream discharge from October 2011 to October 2013 for Sope Creek (a largely urban catchment). b Concentrations of imidacloprid, dinotefuran and acetamiprid along with the corresponding stream discharge from September 2011 to September 2012 for Chattahoochee River. Black bars represent samples where no neonicotinoids were detected. Reproduced from Hladik and Kolpin (2016)
Fig. 8
Fig. 8
Range of neonicotinoid toxicity (L[E]C50, 24–96 h in μmol/L, both lethal and sublethal values included) among all tested aquatic invertebrate orders. For context, three of the most common test species (white bars) for the orders Cladocera (Daphnia magna), Amphipoda (Gammarus pulex) and Diptera (Chironomus dilutus) are shown to illustrate differences in sensitivity by species. Vertical lines within bars represent geometric means of test values. Concentrations are given as molar equivalents micromoles per litre to standardise for the variable molecular weights of the different neonicotinoids. Back conversions to concentrations in micrograms per litre (ppb) can be obtained by multiplying the molar concentration by the molar weight of the neonicotinoid compound. Reproduced from Morrissey et al.

Similar articles

Cited by

References

    1. Alaux C, Brunet J-L, Dussaubat C, Mondet F, Tchamitchan S, Cousin M, Brillard J, Baldy A, Belzunces LP, Le Conte Y. Interactions between Nosema microspores and a neonicotinoid weaken honeybees (Apis mellifera) Environ Microbiol. 2010;12:774–782. doi: 10.1111/j.1462-2920.2009.02123.x. - DOI - PMC - PubMed
    1. Alburaki M, Boutin S, Mercier P-L, Loubier Y, Chagnon M, Derome N. Neonicotinoid-treated Zea mays seeds indirectly affect honeybee performance and pathogen susceptibility in field trials. PLoS One. 2015;10:e0125790. doi: 10.1371/journal.pone.0125790. - DOI - PMC - PubMed
    1. Alburaki M, Cheaib B, Quesnel L, Mercier P-L, Chagnon M, Derome N (2016) Performance of honeybee colonies located in neonicotinoid-treated and untreated cornfields in Quebec. J Appl Entomol 141:112–121
    1. Andersch W, Jeschke P, Thielert W (2010) Combination of methiocarb and one or more compounds selected from thiacloprid, thiamethoxam, acetamiprid, nitenpyram, and dinotefuran; effective animal pests control and for plant seed dressing. Google Patents. United States: Bayer CropScience AG
    1. Anderson TA, Salice CJ, Erickson RA, McMurray ST, Cox SB, Smith LM. Effects of landuse and precipitation on pesticides and water quality in playa lakes of the southern high plains. Chemosphere. 2013;92:84–90. doi: 10.1016/j.chemosphere.2013.02.054. - DOI - PubMed

LinkOut - more resources