. 2017 Jun 8:8:15614.
doi: 10.1038/ncomms15614.

Human LACC1 increases innate receptor-induced responses and a LACC1 disease-risk variant modulates these outcomes

Affiliations

Human LACC1 increases innate receptor-induced responses and a LACC1 disease-risk variant modulates these outcomes

Amit Lahiri et al. Nat Commun. .

Abstract

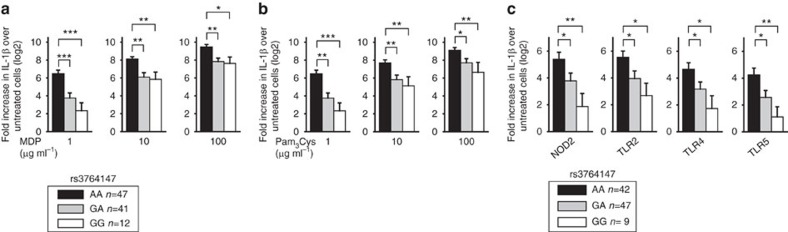
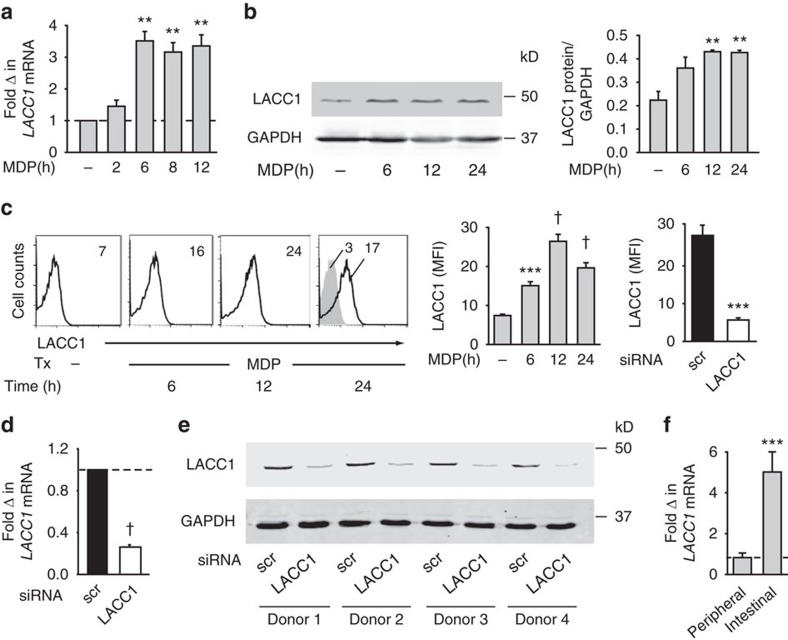
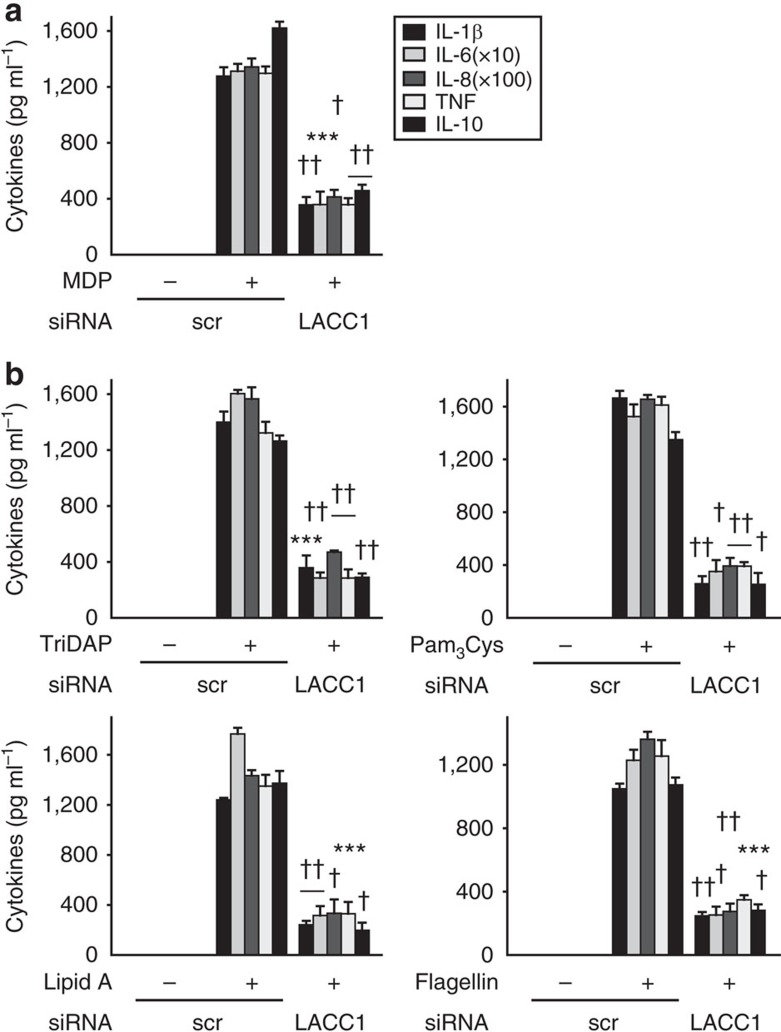
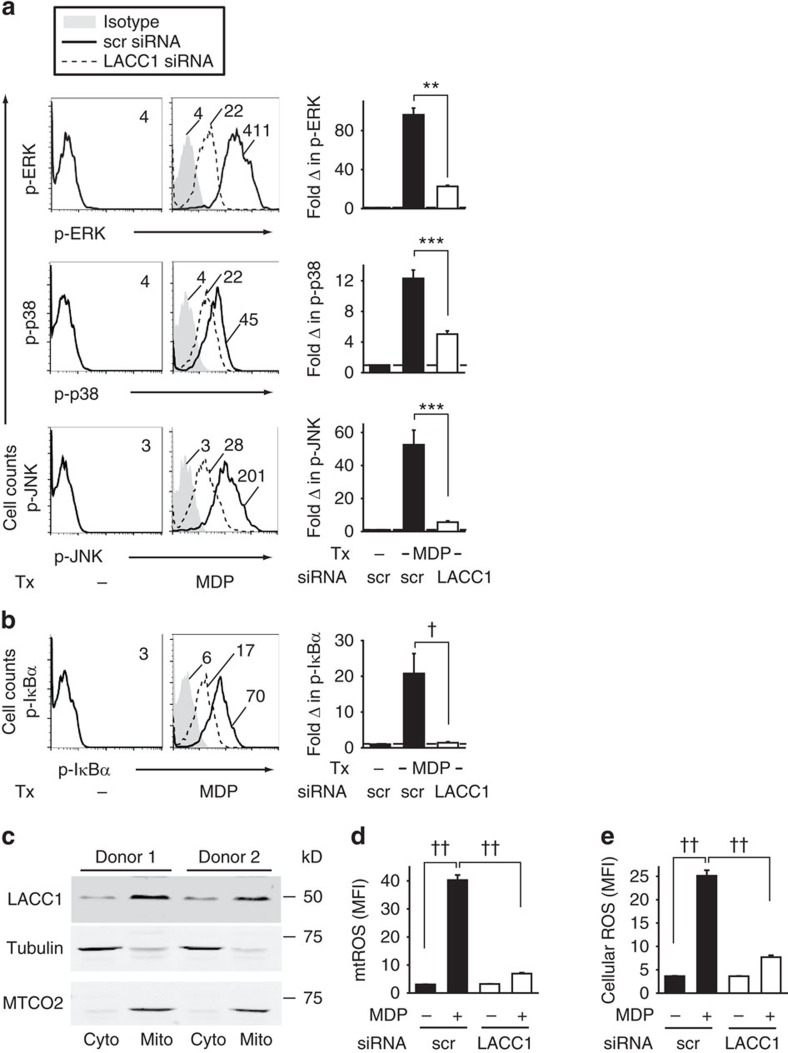
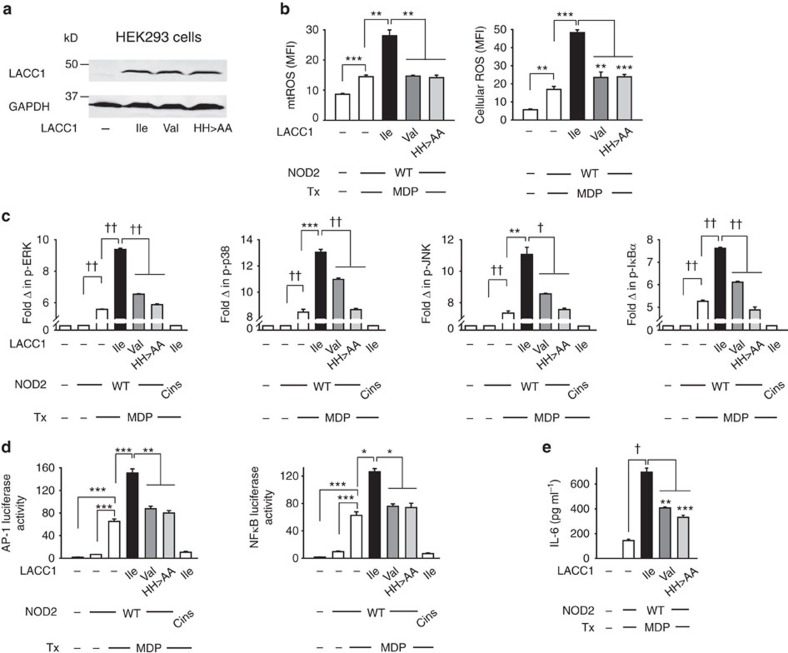
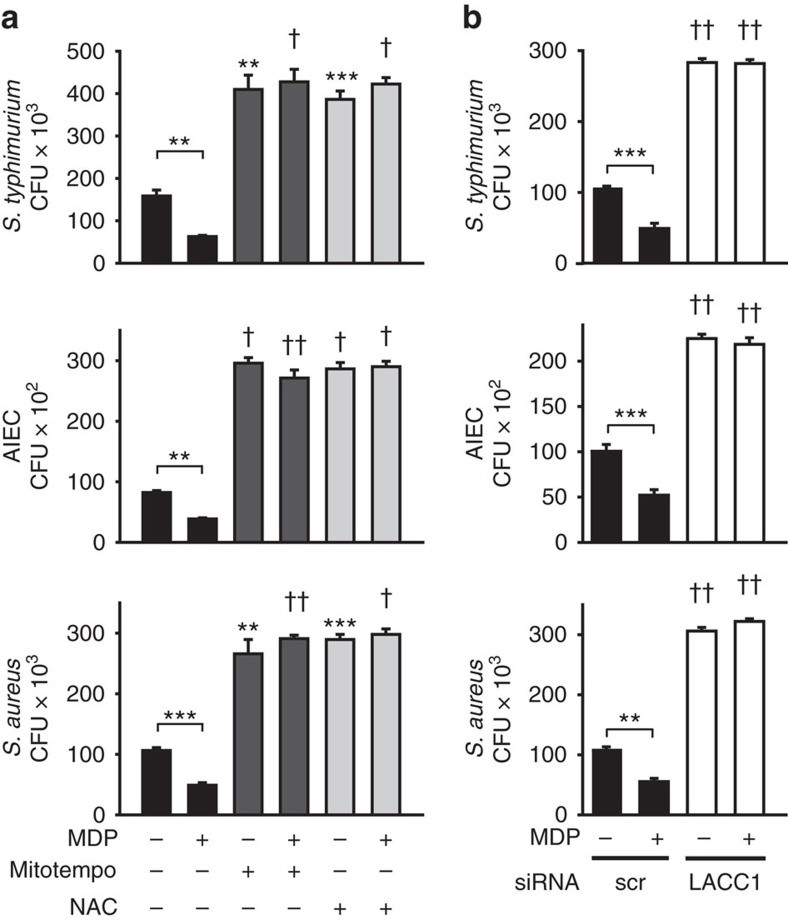
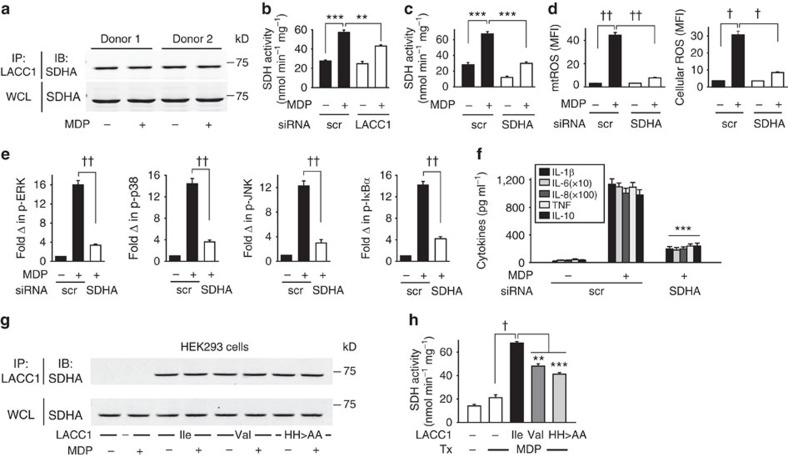
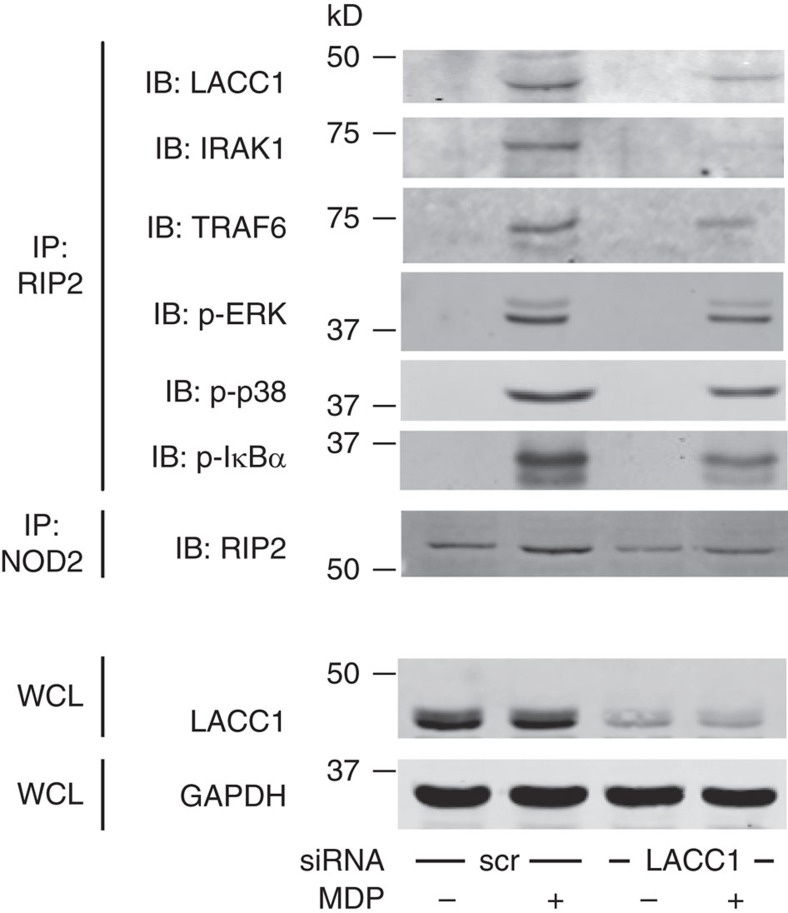
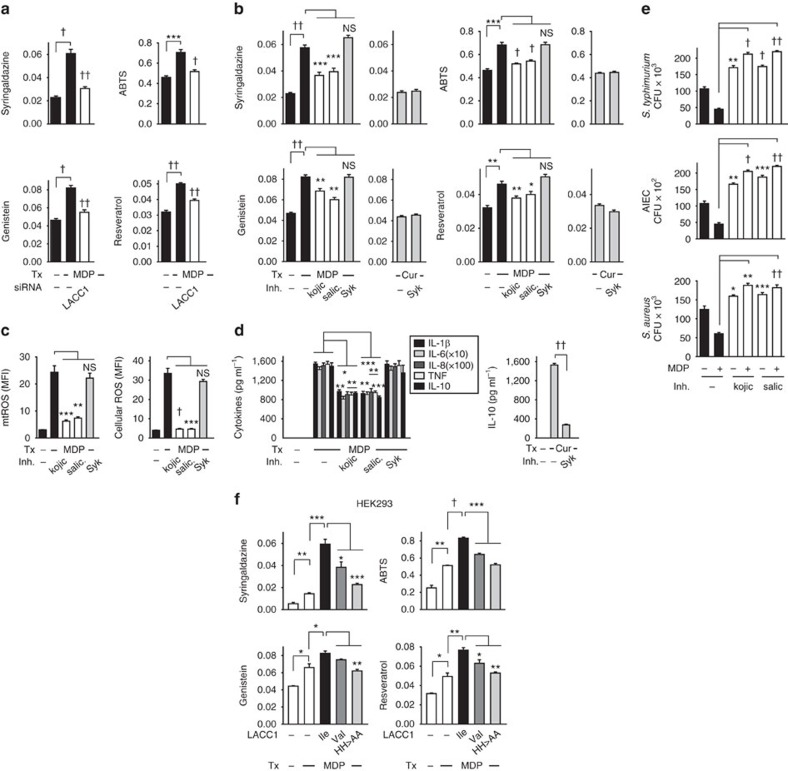
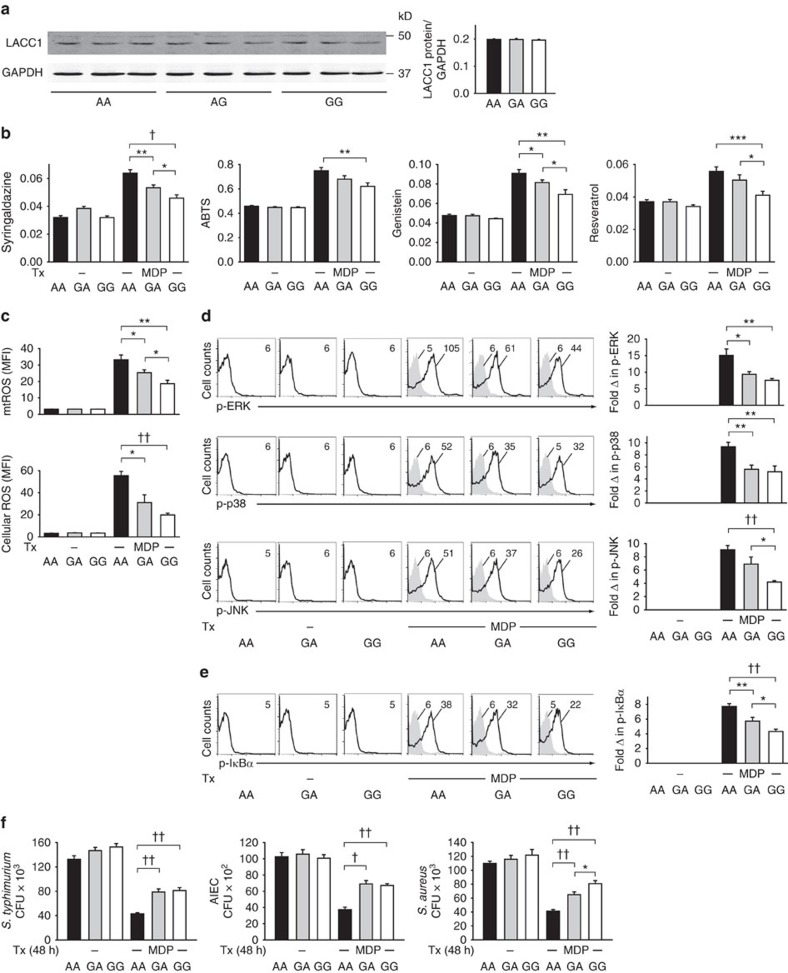
Functional consequences for most inflammatory disease-associated loci are incompletely defined, including in the LACC1 (C13orf31) region. Here we show that human peripheral and intestinal myeloid-derived cells express laccase domain-containing 1 (LACC1); LACC1 is expressed in both the cytoplasm and mitochondria. Upon NOD2 stimulation of human macrophages, LACC1 associates with the NOD2-signalling complex, and is critical for optimal NOD2-induced signalling, mitochondrial ROS (mtROS) production, cytokine secretion and bacterial clearance. LACC1 constitutively associates with succinate dehydrogenase (SDH) subunit A, and amplifies pattern recognition receptor (PRR)-induced SDH activity, an important contributor to mtROS production. Relative to LACC1 Ile254, cells transfected with Crohn's disease-risk LACC1 Val254 or LACC1 with mutations of the nearby histidines (249,250) have reduced PRR-induced outcomes. Relative to LACC1 Ile254 carriers, Val254 disease-risk carrier macrophages demonstrate decreased PRR-induced mtROS, signalling, cytokine secretion and bacterial clearance. Therefore, LACC1 is critical for amplifying PRR-induced outcomes, an effect that is attenuated by the LACC1 disease-risk variant.


Conflict of interest statement

The authors declare no competing financial interests.

Figures

Figure 1
Figure 1. Myeloid cells from LACC1 Val254 disease-risk carriers demonstrate decreased PRR-induced cytokine secretion.
Human MDMs (n=100) were treated for 24 h with (a) 1, 10 or 100 μg ml−1 MDP, or (b) 1, 10 or 100 μg ml−1 Pam3Cys. (c) Human MDDCs (n=98) were treated for 24 h with 1 μg ml−1 MDP (NOD2 ligand), 1 μg ml−1 Pam3Cys (TLR2 ligand), 0.01 μg ml−1 lipid A (TLR4 ligand) or 0.5 ng ml−1 flagellin (TLR5 ligand) for 24 h. Shown is fold IL-1β-secreted protein induction (log2-transformed) upon PRR stimulation stratified on rs3764147 genotype. Error bars depict s.e.m. *P<0.05; **P<0.01; ***P<0.001; determined by 2-tailed t-test.
Figure 2
Figure 2. LACC1 is expressed in human MDMs and intestinal myeloid cells.
Human MDMs were treated with 100 μg ml−1 MDP for the indicated times and assessed for: (a) LACC1 mRNA expression (n=4; with similar results for an additional n=4), (b) LACC1 protein expression by western blot with GAPDH as a loading control along with a summary graph of densitometry in which samples are normalized to GAPDH (n=4) and (c; Left) LACC1 protein expression by flow cytometry. Representative and summarized flow cytometry with the mean fluorescent intensity (MFI) values shown (n=7). Isotype (grey shading). Representation of population gated is shown in Supplementary Fig. 2A. (Right) MDMs were transfected with scrambled or LACC1 siRNA and then treated with MDP for 12 h. Summarized graph for MFI of samples assessed by flow cytometry+s.e.m. (n=7 donors). (d,e) MDMs were transfected with scrambled or LACC1 siRNA and (d) LACC1 mRNA expression+s.e.m. (n=4), and (e) representative western blot for LACC1 expression is shown for 4 of 20 donors. (f) LACC1 mRNA expression was assessed in intestinal (n=7) and peripheral (n=7) myeloid-derived cells and normalized to CD11c. Mean+s.e.m. Scr, scrambled; tx, treatment. **P<0.01; ***P<0.001; P<1 × 10⁻⁴; determined by 2-tailed t-test.
Figure 3
Figure 3. LACC1 amplifies PRR-induced cytokines.
MDMs were transfected with scrambled or LACC1 siRNA, and then treated for 24 h with (a) 100 μg ml−1 MDP (n=4; similar results were observed in an additional n=18), or (b) 100 μg ml−1 TriDAP, 10 μg ml−1 Pam3Cys, 0.1 μg ml−1 lipid A or 5 ng ml−1 flagellin (n=4; similar results were observed in an additional n=8). Cytokine secretion+s.e.m. Scr, scrambled. ***P<0.001; P<1 × 10⁻⁴; ††P<1 × 10⁻⁵; determined by 2-tailed t-test.
Figure 4
Figure 4. LACC1 is required for optimal PRR-induced signalling and mtROS production.
(a,b) MDMs (n=4) were transfected with scrambled or LACC1 siRNA, and then treated for 15 min with 100 μg ml−1 MDP. Left: representative flow cytometry plots with MFI values for (a) phospho-ERK, phospho-p38 and phospho-JNK, and (b) phospho-IκBα. Right: fold phospho-protein induction normalized to untreated cells (represented by the dotted line at 1)+s.e.m. Similar results were observed for an additional n=8. In a subset of individuals for a,b we simultaneously confirmed reduced LACC1 expression with LACC1 siRNA by western blot (Supplementary Fig. 5A) and flow cytometry. (c) MDMs were fractionated into cytoplasmic (cyto) and mitochondrial (mito) compartments and assessed for LACC1 expression. Shown is a representative western blot for LACC1 in two of six individuals. Tubulin and MTCO2 were used as cytoplasmic and mitochondrial loading controls, respectively. (d,e) MDMs were transfected with scrambled or LACC1 siRNA, and then treated with 100 μg ml−1 MDP for 6 h and assessed for: (d) mtROS (n=4) and (e) cellular ROS (n=4). Shown is mean+s.e.m. Similar results were seen in an additional n=8 donors. In a subset of individuals for d,e we simultaneously confirmed reduced LACC1 expression with LACC1 siRNA by western blot (Supplementary Fig. 7B) and flow cytometry. scr, scrambled; Tx, treatment. **P<0.01; ***P<0.001; P<1 × 10⁻⁴; ††P<1 × 10⁻⁵; determined by 2-tailed t-test.
Figure 5
Figure 5. Transfection of the LACC1 risk variant results in decreased NOD2-induced outcomes.
(ae) Empty vector (EV), LACC1 Ile254 or LACC1 Val254 variants, or LACC1 His249,250Ala mutants were transfected into HEK293 cells along with NOD2±AP-1 or NFκB luciferase and Renilla constructs. (a) Western blot for LACC1 expression of transfected cells in one of four replicates. (be) Transfected cells were treated with 100 μg ml−1 MDP and assessed for: (b) mtROS and cellular ROS at 6 h, (c) phospho-protein induction normalized to untreated, EV-transfected cells at 15 min as assessed by flow cytometry, (d) AP-1 and NFκB luciferase activity at 6 h and (e) IL-6 secretion at 24 h. For c,d included is also the Crohn's disease-associated NOD2 LeufsinsC (Cins) variant co-transfected with LACC1 Ile254 as a control for the specificity of NOD2 responsivity to MDP treatment. Represented is mean+s.e.m. for three replicates. Panels b,d,e are representative of two independent experiments. Tx, treatment; WT, wild type. *P<0.05; **P<0.01; ***P<0.001; P<1 × 10⁻⁴; ††P<1 × 10⁻⁵; determined by 2-tailed t-test.
Figure 6
Figure 6. LACC1 is required for optimal NOD2-induced intracellular microbial clearance.
(a) MDMs (n=4) were treated with 100 μg ml−1 MDP for 48 h, and then treated for 1 h with Mito-Tempo (to inhibit mtROS) or N-acetylcysteine (NAC; to neutralize ROS), and co-cultured with S. typhimurium, AIEC or S. aureus. (b) MDMs (n=4) were transfected with scrambled or LACC1 siRNA, and then treated with 100 μg ml−1 MDP for 48 h, followed by co-culture with S. typhimurium, AIEC or S. aureus. Similar results were observed in an additional n=8. Clearance of intracellular bacteria is represented as colony-forming units (CFU)+s.e.m. Significance is compared with the equivalent treatment condition in the absence of inhibitors for a or in scrambled siRNA-transfected cells for b, or as indicated. In a subset of individuals we simultaneously confirmed reduced LACC1 expression with LACC1 siRNA by western blot (Supplementary Fig. 13A) and flow cytometry. Scr, scrambled. **P<0.01; ***P<0.001; P<1 × 10⁻⁴; ††P<1 × 10⁻⁵; determined by 2-tailed t-test.
Figure 7
Figure 7. LACC1 associates with SDHA and contributes to NOD2-induced SDH activity.
(a) MDMs were left untreated or were treated with 100 μg ml−1 MDP for 6 h. Cell lysates were immunoprecipitated (IP) with anti-LACC1 antibody. Associated SDHA was assessed by western blot (IB). Representative western blot in two of four individuals. (b) MDMs (n=4) were transfected with scrambled or LACC1 siRNA, and then treated with 100 μg ml−1 MDP and assessed for SDH activity at 2 h. Similar results were observed in an additional n=8. In a subset of individuals we simultaneously confirmed reduced LACC1 expression with LACC1 siRNA by western blot (Supplementary Fig. 14A) and flow cytometry. (cf) MDMs were transfected with scrambled or SDHA siRNA, and then treated with 100 μg ml−1 MDP and assessed for: (c) SDH activity at 2 h (n=4), (d) mtROS and cellular ROS at 6 h (n=4; similar results in an additional n=4), (e) fold phospho-protein induction normalized to untreated cells at 15 min (n=4) as assessed by flow cytometry, (f) cytokines at 24 h (n=4). (g,h) LACC1 Ile254, Val254 and His249,250Ala variants were transfected into HEK293 cells along with NOD2, and cells were then treated with 100 μg ml−1 MDP. (g) Cell lysates were immunoprecipitated (IP) with anti-LACC1 antibody at 6 h. Associated SDHA was assessed by western blot (IB). Shown is a representative western blot from one of three replicates. (h) SDH activity was assessed. Data represent three replicates and were repeated two independent times. Shown is mean+s.e.m. for (bf,h). WCL, whole cell lysate; Tx, treatment; scr, scrambled. **P<0.01; ***P<0.001; P<1 × 10⁻⁴; ††P<1 × 10⁻⁵; determined by 2-tailed t-test.
Figure 8
Figure 8. LACC1 is recruited to a NOD2-induced signalling complex.
MDMs were transfected with scrambled or LACC1 siRNA, and then treated with 100 μg ml−1 MDP for 15 min. RIP2 or NOD2 were immunoprecipitated (IP) from cell lysates and the recruitment of the indicated proteins was assessed by western blot (IB). GAPDH was used as a loading control. WCL, whole-cell lysate; scr, scrambled.
Figure 9
Figure 9. LACC1 regulates NOD2-induced polyphenol oxidase activity in MDMs.
(a) MDMs were transfected with scrambled or LACC1 siRNA, and then treated with 100 μg ml−1 MDP for 6 h and polyphenol oxidase activity was assessed in cell lysates utilizing syringaldazine, ABTS, genistein and resveratrol as substrates (n=4). Similar results were seen in an additional n=4 for syringaldazine and ABTS. (be) MDMs were preincubated with kojic acid, salicylhydroxamic acid (polyphenol oxidase inhibitors) or a Syk inhibitor for 1 h, and then stimulated with 100 μg ml−1 MDP and assessed for: (b) polyphenol oxidase activity at 6 h (n=8, similar results were seen in an additional n=4), (c) mtROS and cellular ROS at 6 h (n=6, similar results were seen in an additional n=4), (d) cytokines at 24 h (n=4, similar results were seen in an additional n=8) and (e) bacterial clearance (n=4; significance is compared to non-MDP-treated MDMs without inhibitor treatment or as indicated). Curdlan (cur) treatment is used as a control in b,d. (f) LACC1 Ile254, Val254 or His249,250Ala variants were transfected into HEK293 cells along with NOD2. Cells were then treated with 100 μg ml−1 MDP for 6 h. Polyphenol oxidase activity was assessed. Data represent three replicates repeated two independent times. Inh, inhibitors; salic, salicylhydroxamic acid; Tx, treatment. *P<0.05; **P<0.01; ***P<0.001; P<1 × 10⁻⁴; ††P<1 × 10⁻⁵; NS, not significant; determined by 2-tailed t-test.
Figure 10
Figure 10. LACC1 Val254 risk carrier MDMs show reduced LACC1-dependent outcomes with NOD2 stimulation.
MDMs from LACC1 Ile254, Ile/Val254 and Val254 carriers (rs3764147 AA, GA and GG carriers, respectively) were treated with 100 μg ml−1 MDP and assessed for: (a) LACC1 expression at 12 h. Representative western blot and summary of densitometry+s.e.m. for n=9 per genotype. (b) Polyphenol oxidase activity at 6 h (n=15 per genotype). Mean+s.e.m. (c) mtROS (n=8 per genotype) and cellular ROS (n=7 per genotype) at 6 h. Mean+s.e.m. (d) Phospho-ERK, phospho-p38 and phospho-JNK, and (e) phospho-IκBα at 15 min with representative flow cytometry plots showing MFI values and summarized data represented as fold phospho-protein induction normalized to untreated cells+s.e.m. (n=8 per genotype). (f) Intracellular clearance of S. typhimurium, AIEC or S. aureus at 48 h. CFU+s.e.m. (n=10 per genotype). Tx, treatment. *P<0.05; **P<0.01; ***P<0.001; P<1 × 10⁻⁴; ††P<1 × 10⁻⁵; determined by 2-tailed t-test.

References

    1. Abraham C. & Cho J. H. Inflammatory bowel disease. N. Engl. J. Med. 361, 2066–2078 (2009). - PMC - PubMed
    1. Abraham C. & Medzhitov R. Interactions between the host innate immune system and microbes in inflammatory bowel disease. Gastroenterology 140, 1729–1737 (2011). - PMC - PubMed
    1. Lassen K. G. et al. Atg16L1 T300A variant decreases selective autophagy resulting in altered cytokine signaling and decreased antibacterial defense. Proc. Natl Acad. Sci. USA 111, 7741–7746 (2014). - PMC - PubMed
    1. Dhillon S. S. et al. Variants in nicotinamide adenine dinucleotide phosphate oxidase complex components determine susceptibility to very early onset inflammatory bowel disease. Gastroenterology 147, 680–689 (2014). - PubMed
    1. Holland S. M. Chronic granulomatous disease. Clin. Rev. Allergy Immunol. 38, 3–10 (2010). - PubMed

Publication types

MeSH terms