. 2017 Jun 8:8:15711.
doi: 10.1038/ncomms15711.

Pentavalent HIV-1 vaccine protects against simian-human immunodeficiency virus challenge

Affiliations

Pentavalent HIV-1 vaccine protects against simian-human immunodeficiency virus challenge

Todd Bradley et al. Nat Commun. .

Abstract

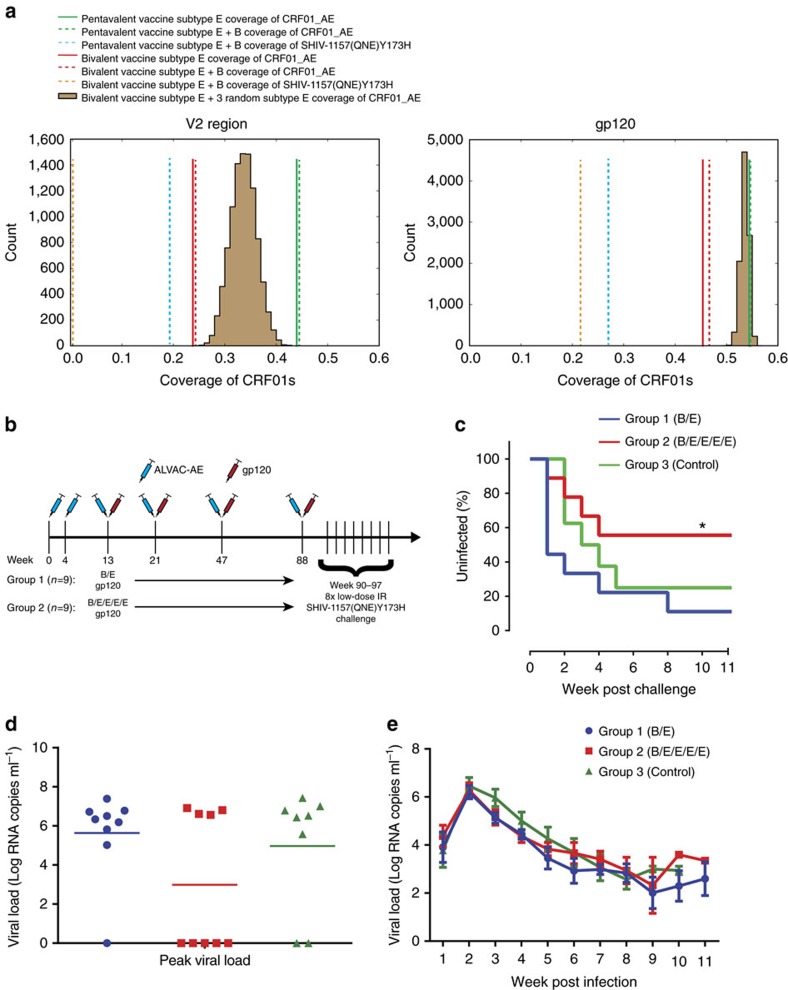
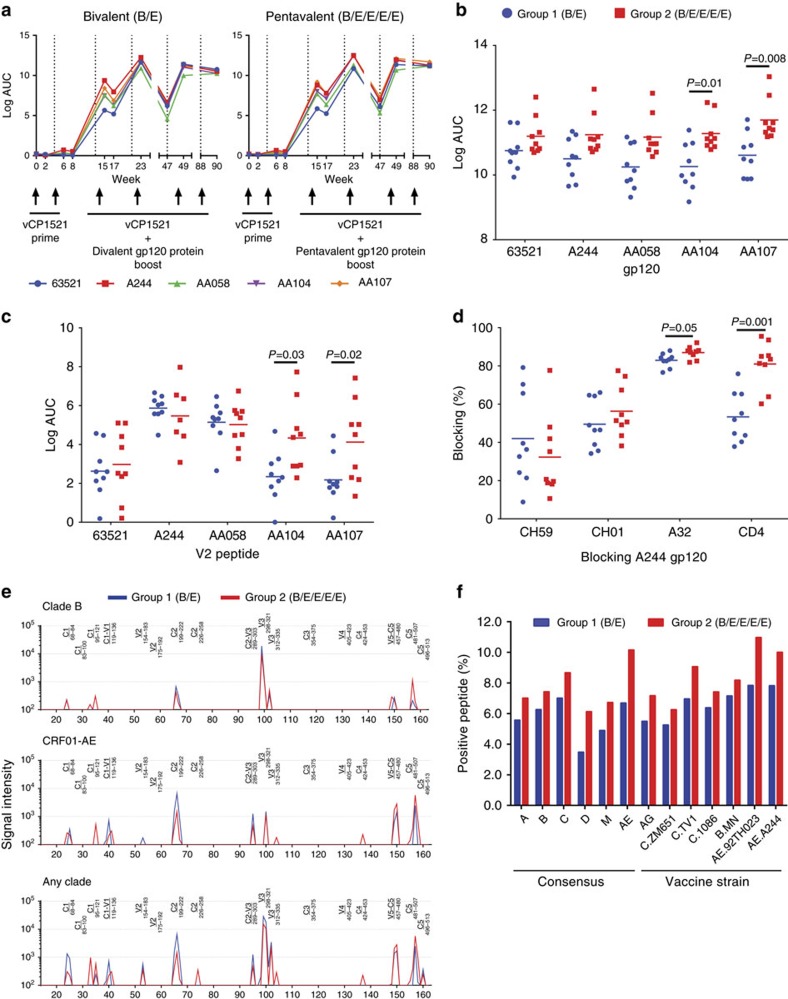
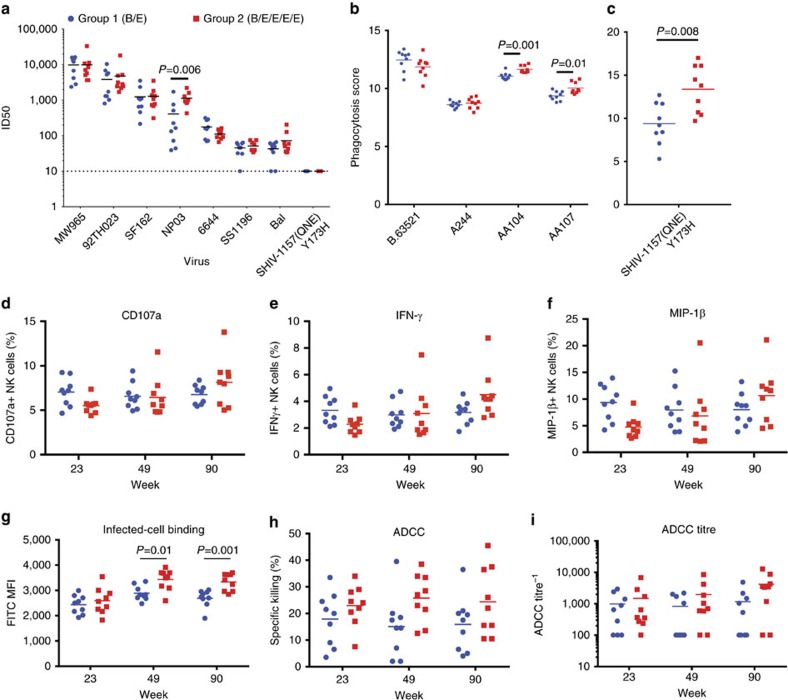
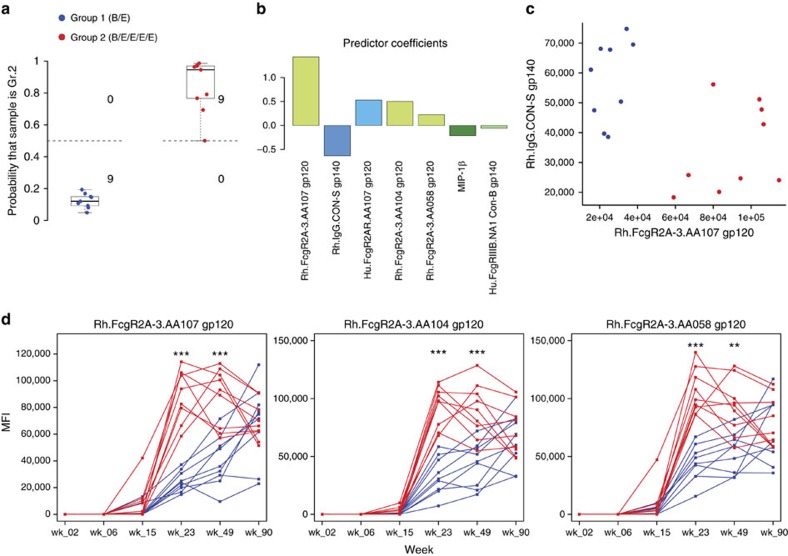
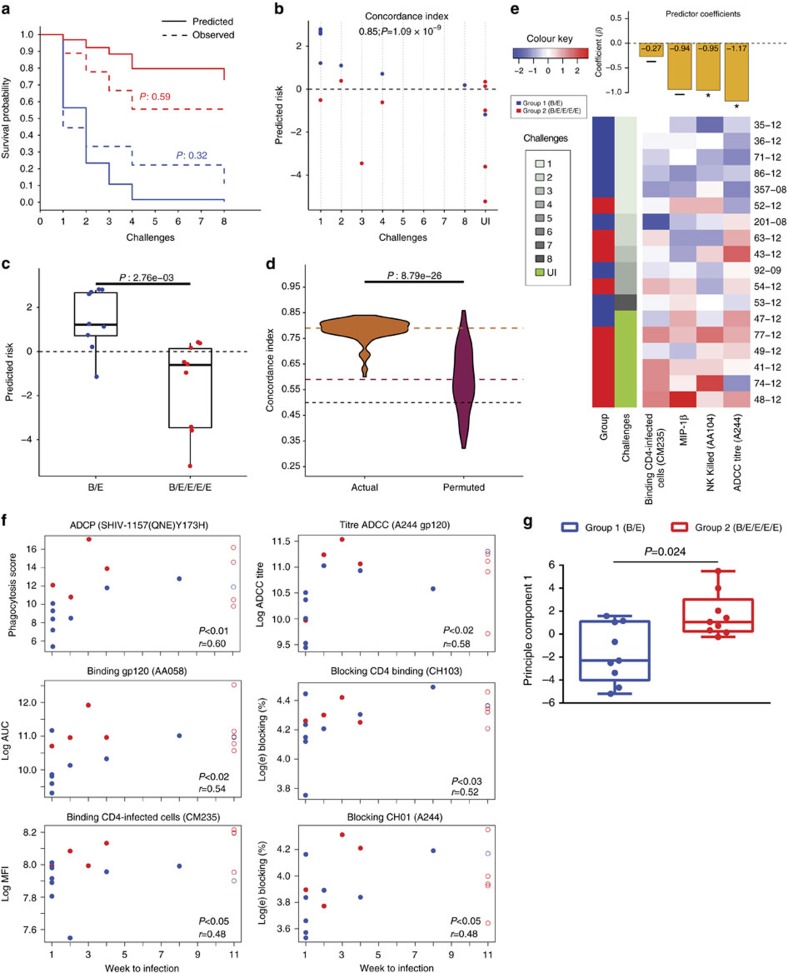
The RV144 Thai trial HIV-1 vaccine of recombinant poxvirus (ALVAC) and recombinant HIV-1 gp120 subtype B/subtype E (B/E) proteins demonstrated 31% vaccine efficacy. Here we design an ALVAC/Pentavalent B/E/E/E/E vaccine to increase the diversity of gp120 motifs in the immunogen to elicit a broader antibody response and enhance protection. We find that immunization of rhesus macaques with the pentavalent vaccine results in protection of 55% of pentavalent-vaccine-immunized macaques from simian-human immunodeficiency virus (SHIV) challenge. Systems serology of the antibody responses identifies plasma antibody binding to HIV-infected cells, peak ADCC antibody titres, NK cell-mediated ADCC and antibody-mediated activation of MIP-1β in NK cells as the four immunological parameters that best predict decreased infection risk that are improved by the pentavalent vaccine. Thus inclusion of additional gp120 immunogens to a pox-prime/protein boost regimen can augment antibody responses and enhance protection from a SHIV challenge in rhesus macaques.


Conflict of interest statement

S.P. and J.T. are employees of Sanofi Pasteur. B.T.K. and B.F.H. have patent applications submitted on vaccine candidates used in this study. The remaining authors declare no competing financial interests.

Figures

Figure 1
Figure 1. Pentavalent vaccine improved coverage of HIV-1 diversity and had increased protection from SHIV challenge.
(a) The sequence coverage of the RV144 viral V2 epitope region (HXB2 positions 154–184) and full subtype E gp120 by the pentavalent vaccine subtype Es (green line; 92TH023, A244, AA058, AA104 and AA107), the pentavalent vaccine subtype Es and B (63521; dashed green line), the pentavalent subtype E and B coverage of the challenge SHIV-1157(QNE)Y173H (dashed blue line), the RV144 bivalent subtype Es (92TH023 and A244; red line), the RV144 bivalent subtypes E and B (63521; dashed red line) and the RV144 bivalent vaccine subtype E plus B SHIV coverage (dashed orange line). The distribution of sequence coverage of 10,000 randomly selected sets of three clade E viruses when combined with A244 and 92TH023 (brown). (b) Schematic of the immunization and challenge regimen. Eighteen rhesus macaques are administered two doses of ALVAC-AE, and then animals either received ALVAC-AE plus a bivalent (n=9) or pentavalent (n=9) protein boost four times. Then all animals were subjected to 8 weekly low-dose intrarectal challenges with SHIV-1157(QNE)Y173H. Unimmunized animals (n=8) were challenged as the control arm. (c) KM plot showing the percentage of uninfected animals after 8 weekly challenges (*Group 2 vs Group 1, P=0.02; Group 2 vs Group 3, P=0.48; one-tailed KM log-rank test). (d) Peak viral load of the infected animals from each vaccine and control group. (e) Viral load tested weekly after initial infection in all the groups. Lines are group means and error bars indicate s.e.m.
Figure 2
Figure 2. Binding antibody responses of ALVAC-bivalent and ALVAC-pentavalent vaccines.
(a) ELISA binding of plasma antibodies to the five vaccine Envs over the course of immunization for the bivalent (left) and pentavalent (right) immunized animals. Binding titres measured as mean Log area under curve (Log AUC) starting at a 1:30 plasma dilution. (b,c) Plasma antibody binding prechallenge at week 90 to (b) vaccine gp120s and (c) vaccine V2 peptides by ELISA measured as Log AUC. Horizontal bars are the group mean and P values calculated using a Wilcoxon–Mann–Whitney test. (d) Plasma antibody blocking prechallenge at week 90 of CH59, CH01 and A32 antibody and sCD4 binding to A244 gp120 measured as percentage of blocking. P values calculated using Wilcoxon–Mann–Whitney test. (e) Graph of binding signal intensity for peptides over the HIV-1 Env from clades B and CRF01-AE and any clade for the bivalent (blue) and pentavalent (red) immunization groups of plasma IgG using a peptide microarray. Peptide microarray contains overlapping 15-mer peptides covering the Env gp160. HIV-1 Env regions labelled above lines. Plotted are the group median values normalized for IgG concentration. (f) Bar graph showing the percentage of positive peptides in a peptide microarray that contains overlapping 15-mer peptides covering the Env gp160 for seven clade consensus (A, B, C, D, M, AE, AG) and six vaccine strains (ZM651, TV1, 1086, MN, 92TH023 and A244) for all animals in both vaccine groups. Group average reported. Positive threshold is signal intensity/IgG concentration >100.
Figure 3
Figure 3. Plasma antibody neutralizing and non-neutralizing effector functions.
(a) Plasma neutralization of Tier-1 viruses and the Tier-2 challenge SHIV prior to challenge at week 90 measured in the TZM-bl neutralization assay. ID50 of individual animals displayed. Horizontal bars are the group mean. P values calculated using Wilcoxon–Mann–Whitney test. (b,c) Phagocytosis of vaccine Env and SHIV-1157(QNE)Y173 gp120-coated beads by group 1 and group 2 plasma before challenge at week 90 by THP-1 cells. Palivizumab and HIVIG used as negative and positive control antibodies. Average of two replicate experiments. Bead phagocytosis was quantified using the phagocytosis score. Horizontal bars are the group mean. P values calculated using Wilcoxon–Mann–Whitney test. Panel ADCP assay was performed using a lower cell density to increase assay sensitivity. (df) Antibody-dependent NK cell activation. Purified plasma IgG from each animal from groups 1 and 2 were tested for surface expression or production of (d) CD107a, (e) intracellular expression of IFN-γ (f) and MIP-1β by primary NK cells in the presence of A244 gp120. Average of two replicate experiments. Horizontal bars are the group mean. (g) Plasma antibody binding from group 1 (B/E) in blue and group 2 (B/E/E/E/E) in red against CM235-infected CD4 T cells (CEM.NKRCCR5) measured after the last three protein boosts at weeks 23, 49 and 90 using the Luc-based ADCC assay. Horizontal bars are the group mean. P values calculated using Wilcoxon–Mann–Whitney test. (h) Plasma antibody ADCC from group 1 (B/E) in blue and group 2 (B/E/E/E/E) in red of CM235-infected CD4 T cells (CEM.NKRCCR5) measured by percentage of cell killing after the last three protein boosts at weeks 23, 49 and 90. (i) Peak ADCC antibody titres (end point plasma dilution above previous established positive cutoff) from group 1 (B/E) in blue and group 2 (B/E/E/E/E) in red of CM235-infected CD4 T cells (CEM.NKRCCR5) after the last three protein boosts at weeks 23, 49 and 90. Horizontal bars are the group mean.
Figure 4
Figure 4. Bivalent and pentavalent vaccines elicited different antibody responses that evolved over time.
(a) Probability of each sample to be predicted as belonging to the pentavalent group. The decision boundary of the logistic classifier is shown at 0.5 (dashed line). (b) Logistic regression coefficients for the variables selected by the final LASSO-regularized model trained using all samples. The variables are ordered in descending order by magnitude of coefficient. (c) Bi-plot of the two variables with the highest magnitude coefficients in the final model. Each point represents a sample. (d) Temporal plots of variables correlated with the pentavalent group illustrating the evolution of group differences over time. The differences between groups, at each time point, were tested for significance with Wilcoxon–Mann–Whitney; *P<0.05, **P<0.01, ***P<0.001.
Figure 5
Figure 5. Immune correlates of decreased infection risk.
(a) Comparison between the group-wise observed KM curve and predicted survival probabilities. The probabilities were predicted for the ‘mean animal' of each group, according to a final model trained with all animals. The P values were calculated using the log-rank test. (b) Predicted relative risk of infection for individual animals over the representative ninefold cross-validation. The risk for each animal was predicted relative to the mean of all 18 animals, whose relative risk is 0 (horizontal dashed line). (c) Group-wise comparison of the predicted relative risk of infection for individual animals over the representative ninefold cross-validation. The P value was calculated using Wilcoxon–Mann–Whitney. (d) Comparison of C-index values from 100 repetitions of ninefold cross-validation using actual (orange) versus permuted (red) time-to-infection labels. Significance was tested with Wilcoxon–Mann–Whitney. The horizontal dashed lines represent the median C-indices (actual labels: orange; permuted: red) and the baseline for random prediction (0.5: black). (e) Heatmap of the most predictive features from repeated cross-validation. The animals (rows) are ordered in ascending order of time-to-infection. The barplot at the top shows regression coefficients from the final model trained with all samples (Cox PH P values: *P<0.05; —, not significant). (f) Correlation of antibody ADCP, ADCC, binding and blocking at week 90 with the number of weeks after challenge required to establish infection. The plotted data reflect only the vaccinated animals and not controls. Group 1 (B/E) in blue and group 2 (B/E/E/E/E) in red; open circles indicate animals uninfected after eight challenges. P values reflect Spearman rank correlation tests, and r values reflect Spearman rho. (g) Graph of the PC composite score, which is the first principle component of the measures that had a significant Spearman correlation with weeks to infection. The group comparison was performed by Exact Wilcoxon.
Figure 6
Figure 6. Isolation of antibodies with attributes of decreased infection risk.
(a) Chart of numbers of HIV-1-reactive mAbs isolated by antigen-specific single-cell sorting and tested for binding to gp120 proteins by ELISA. (b) Binding of eight mAbs to the five vaccine gp120 proteins in ELISA measured by EC50. (c) Competitive blocking ELISA of CH01, 697D, CH58 and CH59 by isolated antibodies DH638, DH637 and DH641 measured as percentage of blocking. (d) ADCC of CM235-infected CD4+ T cells by DH637, DH638, DH641 and DH640 measured by percentage of cell killing. Synagis and A32 antibodies used as negative and positive controls, respectively. (e) Competitive blocking ELISA of sCD4 by isolated antibodies DH631, DH632, DH633, DH635 and DH640 measured as percentage of blocking. (f) Antibody neutralization of Tier-1 viruses (MN, MW965, CH505w4.3, SF162, Bal, 92TH023, NP03 and 6644) and Tier-2 viruses (Q168, CM244 and SHIV-1157(QNE)Y173H) measured in the TZM-bl neutralization assay as IC50.

Similar articles

Cited by

References

    1. Rerks-Ngarm S. et al.. Vaccination with ALVAC and AIDSVAX to prevent HIV-1 infection in Thailand. N. Engl. J. Med. 361, 2209–2220 (2009). - PubMed
    1. Robb M. L. et al.. Risk behaviour and time as covariates for efficacy of the HIV vaccine regimen ALVAC-HIV (vCP1521) and AIDSVAX B/E: a post-hoc analysis of the Thai phase 3 efficacy trial RV 144. Lancet 12, 531–537 (2012). - PMC - PubMed
    1. Flynn N. M. et al.. Placebo-controlled phase 3 trial of a recombinant glycoprotein 120 vaccine to prevent HIV-1 infection. J. Infect. Dis. 191, 654–665 (2005). - PubMed
    1. Pitisuttithum P. et al.. Randomized, double-blind, placebo-controlled efficacy trial of a bivalent recombinant glycoprotein 120 HIV-1 vaccine among injection drug users in Bangkok, Thailand. J. Infect. Dis. 194, 1661–1671 (2006). - PubMed
    1. Burton D. R. & Mascola J. R. Antibody responses to envelope glycoproteins in HIV-1 infection. Nat. Immunol. 16, 571–576 (2015). - PMC - PubMed

Publication types

MeSH terms