A High-Protein Diet Reduces Weight Gain, Decreases Food Intake, Decreases Liver Fat Deposition, and Improves Markers of Muscle Metabolism in Obese Zucker Rats
- PMID: 28594375
- PMCID: PMC5490566
- DOI: 10.3390/nu9060587
A High-Protein Diet Reduces Weight Gain, Decreases Food Intake, Decreases Liver Fat Deposition, and Improves Markers of Muscle Metabolism in Obese Zucker Rats
Abstract
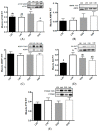
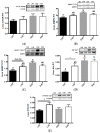
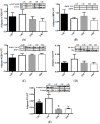
A primary factor in controlling and preventing obesity is through dietary manipulation. Diets higher in protein have been shown to improve body composition and metabolic health during weight loss. The objective of this study was to examine the effects of a high-protein diet versus a moderate-protein diet on muscle, liver and fat metabolism and glucose regulation using the obese Zucker rat. Twelve-week old, male, Zucker (fa/fa) and lean control (Fa/fa) rats were randomly assigned to either a high-protein (40% energy) or moderate-protein (20% energy) diet for 12 weeks, with a total of four groups: lean 20% protein (L20; n = 8), lean 40% protein (L40; n = 10), obese 20% protein (O20; n = 8), and obese 40% protein (O40; n = 10). At the end of 12 weeks, animals were fasted and euthanized. There was no difference in food intake between L20 and L40. O40 rats gained less weight and had lower food intake (p < 0.05) compared to O20. O40 rats had lower liver weight (p < 0.05) compared to O20. However, O40 rats had higher orexin (p < 0.05) levels compared to L20, L40 and O20. Rats in the L40 and O40 groups had less liver and muscle lipid deposition compared to L20 and L40 diet rats, respectively. O40 had decreased skeletal muscle mechanistic target of rapamycin complex 1 (mTORC1) phosphorylation and peroxisome proliferator-activated receptor gamma (PPARγ) mRNA expression compared to O20 (p < 0.05), with no difference in 5' AMP-activated protein kinase (AMPK), eukaryotic translation initiation factor 4E binding protein 1 (4EBP1), protein kinase B (Akt) or p70 ribosomal S6 kinase (p70S6K) phosphorylation. The data suggest that high-protein diets have the potential to reduce weight gain and alter metabolism, possibly through regulation of an mTORC1-dependent pathway in skeletal muscle.
Keywords: body composition; diabetes; diet; liver; muscle; obesity; protein.
Conflict of interest statement
The authors declare no conflict of interest.
Figures


Similar articles
-
Topiramate reduces energy and fat gains in lean (Fa/?) and obese (fa/fa) Zucker rats.Obes Res. 2000 Dec;8(9):656-63. doi: 10.1038/oby.2000.84. Obes Res. 2000. PMID: 11225714
-
Leucine supplementation at the onset of high-fat feeding does not prevent weight gain or improve glycemic regulation in male Sprague-Dawley rats.J Physiol Biochem. 2016 Dec;72(4):781-789. doi: 10.1007/s13105-016-0516-2. Epub 2016 Aug 20. J Physiol Biochem. 2016. PMID: 27544228
-
Dietary fat type and level influence adiposity development in obese but not lean Zucker rats.Proc Soc Exp Biol Med. 1998 May;218(1):38-44. doi: 10.3181/00379727-218-44265. Proc Soc Exp Biol Med. 1998. PMID: 9572150
-
Abnormal polyunsaturated lipid metabolism in the obese Zucker rat, with partial metabolic correction by gamma-linolenic acid administration.Metabolism. 1993 Sep;42(9):1127-40. doi: 10.1016/0026-0495(93)90270-x. Metabolism. 1993. PMID: 8412765
-
Alpha-lipoic acid supplementation reduces mTORC1 signaling in skeletal muscle from high fat fed, obese Zucker rats.Lipids. 2014 Dec;49(12):1193-201. doi: 10.1007/s11745-014-3964-x. Epub 2014 Nov 1. Lipids. 2014. PMID: 25366515
Cited by
-
Determination of the Effects of Duodenal Infusion Soy Protein Hydrolysate on Hepatic Glucose and Lipid Metabolism in Pigs Through Multi-Omics Analysis.Front Nutr. 2022 Apr 26;9:838617. doi: 10.3389/fnut.2022.838617. eCollection 2022. Front Nutr. 2022. PMID: 35558750 Free PMC article.
-
Deleterious Effect of High-Fat Diet on Skeletal Muscle Performance Is Prevented by High-Protein Intake in Adult Rats but Not in Old Rats.Front Physiol. 2022 Jan 17;12:749049. doi: 10.3389/fphys.2021.749049. eCollection 2021. Front Physiol. 2022. PMID: 35111075 Free PMC article.
-
Association between macronutrients intake and liver dysfunction among tuberculosis patients in rural China.Asia Pac J Clin Nutr. 2023 Dec;32(4):444-459. doi: 10.6133/apjcn.202312_32(4).0009. Asia Pac J Clin Nutr. 2023. PMID: 38135480 Free PMC article.
-
Vitamin B6 improves blood parameters in rats fed a protein-deficient diet and subjected to moderate, long-term exercise.Cent Eur J Immunol. 2019;44(1):23-32. doi: 10.5114/ceji.2019.83266. Epub 2019 Apr 15. Cent Eur J Immunol. 2019. PMID: 31114433 Free PMC article.
-
High-Protein Concentrated Pro-Yogurt (Pro-WPI) Enriched With Whey Protein Isolate Improved Athletic Anemia and Performance in a Placebo-Controlled Study.Front Nutr. 2022 Jan 20;8:788446. doi: 10.3389/fnut.2021.788446. eCollection 2021. Front Nutr. 2022. PMID: 35127786 Free PMC article.
References
-
- Board F.A.N. In: Dietary Reference Intakes for Energy, Carbohydrate, Fiber, Fat, Fatty Acids, Cholesterol, Protein and Amino Acids. Medicine, I.O., editor. The National Academies Press; Washington, DC, USA: 2005. - PubMed
-
- Farnsworth E., Luscombe N.D., Noakes M., Wittert G., Argyiou E., Clifton P.M. Effect of a high-protein, energy-restricted diet on body composition, glycemic control, and lipid concentrations in overweight and obese hyperinsulinemic men and women. Am. J. Clin. Nutr. 2003;78:31–39. - PubMed
-
- Gannon M.C., Nuttall F.Q., Saeed A., Jordan K., Hoover H. An increase in dietary protein improves the blood glucose response in persons with type 2 diabetes. Am. J. Clin. Nutr. 2003;78:734–741. - PubMed
MeSH terms
Substances
LinkOut - more resources
Full Text Sources
Other Literature Sources
Research Materials

