. 2017 Jul;12(7):1326-1348.
doi: 10.1038/nprot.2017.030. Epub 2016 Jun 8.

mRNA quantification using single-molecule FISH in Drosophila embryos

Affiliations

mRNA quantification using single-molecule FISH in Drosophila embryos

Tatjana Trcek et al. Nat Protoc. 2017 Jul.

Abstract

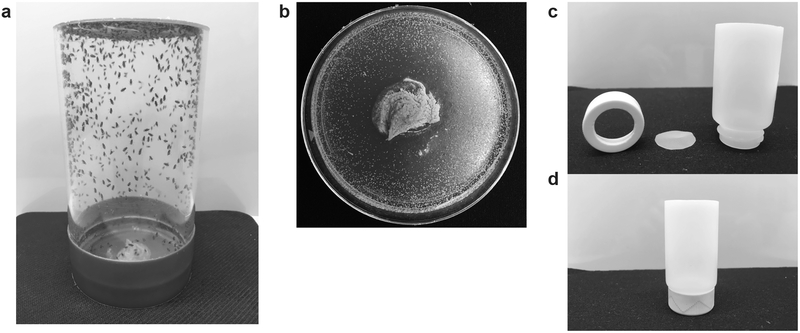
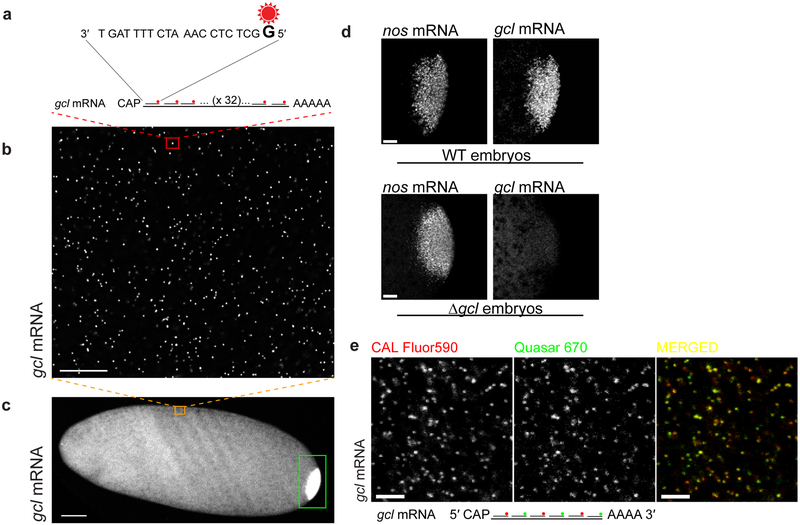
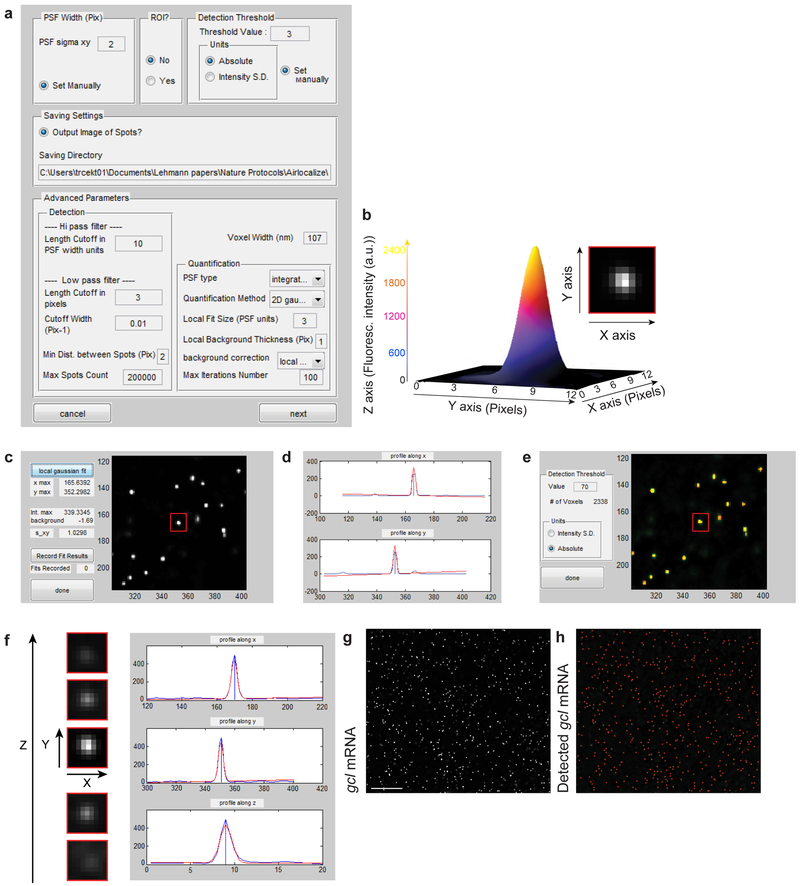
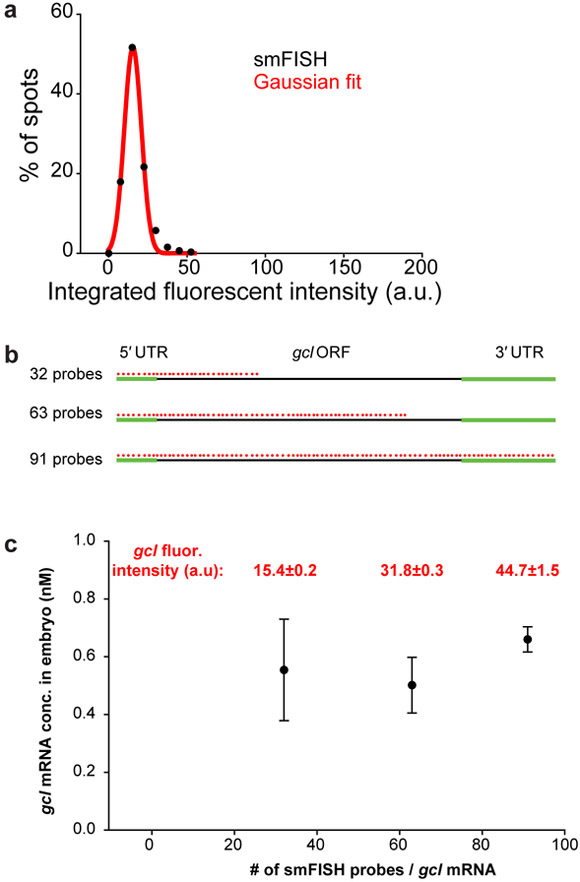
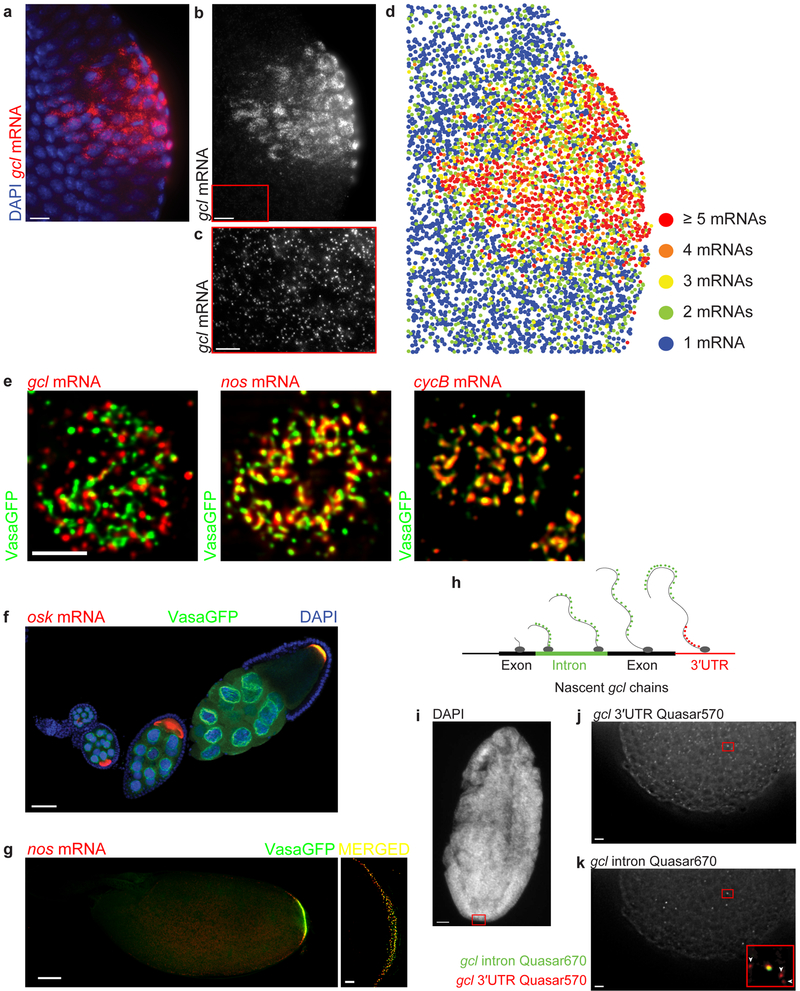
Spatial information is critical to the interrogation of developmental and tissue-level regulation of gene expression. However, this information is usually lost when global mRNA levels from tissues are measured using reverse transcriptase PCR, microarray analysis or high-throughput sequencing. By contrast, single-molecule fluorescence in situ hybridization (smFISH) preserves the spatial information of the cellular mRNA content with subcellular resolution within tissues. Here we describe an smFISH protocol that allows for the quantification of single mRNAs in Drosophila embryos, using commercially available smFISH probes (e.g., short fluorescently labeled DNA oligonucleotides) in combination with wide-field epifluorescence, confocal or instant structured illumination microscopy (iSIM, a super-resolution imaging approach) and a spot-detection algorithm. Fixed Drosophila embryos are hybridized in solution with a mixture of smFISH probes, mounted onto coverslips and imaged in 3D. Individual fluorescently labeled mRNAs are then localized within tissues and counted using spot-detection software to generate quantitative, spatially resolved gene expression data sets. With minimum guidance, a graduate student can successfully implement this protocol. The smFISH procedure described here can be completed in 4-5 d.


Figures

Figure 1.
Figure 1.. Collecting and fixing fly embryos for smFISH.
(a) Egg collection cage housing fruit flies and mounted with an apple juice plate containing yeast paste. (b) Apple juice plate with yeast paste and laid embryos. (c,d) Assembly of the egg collection basket.
Figure 2.
Figure 2.. Detection of single, smFISH-hybridized mRNAs in Drosophila.
(a-c) (a) Schematic of a germ-cell-less (gcl) mRNA hybridized with 32 fluorescently-labeled, commercially available smFISH probes. (b) gcl mRNA, hybridized with 32 smFISH probes, appears as a bright fluorescent spot (red box) against a uniform autofluorescent embryo background. (c) Uniformly dispersed, single gcl mRNAs located ventrally (orange box) in the Drosophila embryo. Nearly 3 per cent of gcl localize to embryo’s posterior (green box). (d) Hybridization of smFISH probes to their target RNA is specific; fluorescent signal cannot be detected if the target RNA is not expressed. In the absence of gcl mRNA expression (in embryos laid by mothers mutated for gcl gene expression (Δgcl embryos)), gcl smFISH signal cannot be detected, while the fluorescence of a control nanos (nos) mRNA, also enriched at the posterior pole, remains unaffected. (e) gcl hybridized with interchanging spectrally distinct CAL Fluor590 and Quasar 670 probes. The two fluorescent signals overlap indicating a bona fide detection of single mRNA molecules. Scale bar in b and e is 5 µm, in d is 10 µm and in c is 50 µm. Images in b and c were acquired with a widefield epifluorescence microscope and in d and e with a laser scanning confocal microscope.
Figure 3.
Figure 3.. Workflow of the single mRNA molecule detection using Airlocalize.
(a) Defining the microscope parameters for single mRNA detection. (b) A heat map demonstrating the spatial distribution of the fluorescence intensity of a single smFISH-labeled gcl mRNA, reported in arbitrary units (a.u.). The inset demonstrates a single plane close-up of a gcl mRNA hybridized with 32 smFISH probes acquired on a widefield epifluorescence microscope. (c,d) Determining the two dimensional (2D) Intensity profile of a smFISH-labeled gcl mRNA. An example of a single fluorescently labeled mRNA (c, red box) and its Intensity profile are shown. Blue line in d indicates the profile of a fluorescent mRNA along the X and Y axis, red line is the Gaussian fit to the PSF. (e) Determining the fluorescent intensity threshold for mRNA detection. Green spots are smFISH labeled gcl mRNAs. Red spots are gcl mRNAs that have fluorescent intensity larger than the specified detection threshold intensity. Yellow indicates co-localization between smFISH-labeled gcl and thresholded gcl fluorescent signal. (f) Determining the Intensity profile of an mRNA in 3D. Blue line indicates the Intensity of a fluorescent mRNA along the X, Y and Z axis, red line is the Gaussian fit to the 3D profile. (g,h) Images showing smFISH-labeled gcl mRNAs found in the middle of the embryo (see Fig. 2b) before (g) and after (h) spot detection using Airlocalize. In h, detected single gcl mRNAs are marked as red spots. Scale bar in g is 5 µm.
Figure 4.
Figure 4.. Determining the fluorescent intensity of a single mRNA molecule.
(a) To determine the average integrated fluorescent intensity of a single smFISH-labeled gcl mRNA detected in Fig. 3 g and h, the integrated fluorescence intensities of all detected spots in h are plotted as a histogram (black circles) and fitted to a Gaussian curve (red line). The peak of the Gaussian fit determines the average integrated fluorescence intensity of a single gcl mRNA, here hybridized with 32 singly-labeled Quasar 670 probes, which, with given imaging and microscope parameters was 15.4 ± 0.2a.u. (R2=0.99). (b,c) Adding more smFISH probes to the probe mix increases the integrated fluorescence intensity of a single mRNA but does not change the number of detected gcl mRNAs significantly. gcl was labeled with 32 (gcl 1st third probe mix), 63 (gcl 1st third and 2nd third smFISH probe mix) or 91 (gcl 1st third, 2nd third and 3rd smFISH probe mix) Quasar 670 smFISH probes (b) and an average integrated fluorescent intensity of a single gcl mRNA determined ventrally in the early embryo for each probe mix, as described above. The average integrated fluorescence intensity of a single gcl mRNA, hybridized with 32 singly-labeled Quasar 670 probes was 15.4 ± 0.2 a.u. (R2=0.99) (see Fig. 3), with 63 singly-labeled Quasar 670 probes was 31.8 ± 0.3 a.u. (R2=0.99) and with 91 singly-labeled Quasar 670 probes was 44.7 ± 1.5 a.u. (R2=0.99) (gcl fluorescent intensity reported in red above the graph). (c) Thus, integrated fluorescent intensity of a labeled mRNA scales linearly with the number of smFISH probes hybridizing to the mRNA, yet the number of detected gcl mRNAs, reported as nM concentration of gcl mRNA per embryo, does not change.
Figure 5.
Figure 5.. smFISH enables spatial and quantitative characterization of gene expression in the fly tissue.
(a-c) Images of gcl (red) localized at the posterior pole of an embryo forming crescents surrounding the nuclei (labeled with DAPI, blue) of the newly formed primordial germ cells during the 13th nuclear cycle of the embryonic development. The inset marked with a red box in b highlights un-localized, somatic gcl mRNA, further magnified and contrast adjusted in c. (d) Heat map of gcl mRNA demonstrates that outside of the posterior pole, the majority of gcl transcripts are found as single mRNAs. Only approximately 3% of maternally-deposited gcl mRNA is localized to germ granules found at posterior pole of an embryo (Fig. 2c, 5e) where it groups within a diffraction limited volume and forms homotypic clusters composed of multiple gcl mRNA molecules. To create a heat map, the average integrated fluorescent intensity of a single gcl was first determined (see Fig. 3, 4a) after which this value was used to calibrate the intensities of clustered gcl spots at the posterior pole. These had higher fluorescent intensities and therefore contained multiple gcl mRNAs in a diffraction-limited volume. During spot detection, Airlocalize determines the position of each single mRNA and mRNA cluster in 2D and 3D with sub-pixel resolution. These coordinates are then used to plot the spatial distribution individual mRNAs and clusters in the embryo. In all panels, three consecutive Z planes (z = 400 nm) were maximally projected and subsequently analyzed. All images were acquired with a widefield microscope in 3D and subsequently deconvolved using Huygens. (e) iSIM super-resolution imaging reveals a detailed spatial organization of mRNA-bound germ granules. Germ granule-localized gcl, nos and cycB mRNAs group to form homotypic mRNA clusters that inhabit different positions within germ granules. gcl clusters are located at the germ granule periphery while cycB clusters are located in the center of the granule. nos mRNA clusters are located midway between gcl and cycB clusters. Shown are images of granules found in the 10th nuclear cycle of early embryonic development. Images were acquired in 3D and afterwards deconvolved using Huygens. (f,g) Images demonstrating accumulation of oskar (osk) and nanos (nos) mRNA (red), respectively at the posterior pole of a developing oocyte through oogenesis. During late oogenesis, Oskar protein recruits Vasa protein (green) to the posterior pole to form germ plasm. Germ plasm was visualized with a Vasa transgene, tagged with a green fluorescent protein (GFP). First 10 oogenic stages are shown in f. In g, an oocyte found in late oogenic stage 14 is shown. Nuclei in f were stained with the DAPI stain (blue). Images in f and g (left panel in g) were acquired with a laser scanning confocal microscope. An image of the germ plasm shown under “MERGED” was acquired with an iSIM. (h-k) Intronic smFISH probes reveal active sites of transcription and discriminate between spliced mature transcripts and unspliced nascent transcripts. (h) A schematic depicting detection of gcl mRNA transcription site using smFISH probes hybridizing to either gcl introns (green dots) or gcl 3′UTR (red dots). (i) An image of a DAPI stained embryo to visualize nuclei. (j,k) Before being spliced, smFISH-hybridized introns (green) co-localize with the smFISH probes hybridizing to gcl 3′UTR (red) at the site of transcription (inset in k, yellow spot). Mature gcl mRNAs do not bind intronic probes (inset in k, arrowheads). Scale bar in e is 2.5 µm, in c, g (right panel under merged) j and k is 5 µm, 10 µm in a and b and 50 µm in f, g (left panel) and h.

References

    1. Femino AM, Fay FS, Fogarty K & Singer RH Visualization of single RNA transcripts in situ. Science 280, 585–590 (1998). - PubMed
    1. Raj A, van den Bogaard P, Rifkin SA, van Oudenaarden A & Tyagi S Imaging individual mRNA molecules using multiple singly labeled probes. Nat Methods 5, 877–879, doi:10.1038/nmeth.1253 (2008). - DOI - PMC - PubMed
    1. https://www.biosearchtech.com/support/resources/stellaris-citation-center.

    1. Little SC, Tikhonov M & Gregor T Precise developmental gene expression arises from globally stochastic transcriptional activity. Cell 154, 789–800, doi:10.1016/j.cell.2013.07.025 (2013). - DOI - PMC - PubMed
    1. Trcek T et al. Drosophila germ granules are structured and contain homotypic mRNA clusters. Nat Commun 6, 7962, doi:10.1038/ncomms8962 (2015). - DOI - PMC - PubMed

MeSH terms

LinkOut - more resources