

Noninvasive assessment of respiratory muscle strength and activity in Myotonic dystrophy
- PMID: 28594857
- PMCID: PMC5464542
- DOI: 10.1371/journal.pone.0177318
Noninvasive assessment of respiratory muscle strength and activity in Myotonic dystrophy
Abstract
Objective: To evaluate sensitivity/specificity of the maximum relaxation rate (MRR) of inspiratory muscles, amplitude of electromyographic activity of the sternocleidomastoid (SCM), scalene (SCA), parasternal (2ndIS) and rectus abdominis (RA) muscles; lung function and respiratory muscle strength in subjects with Myotonic dystrophy type 1 (DM1) compared with healthy subjects.
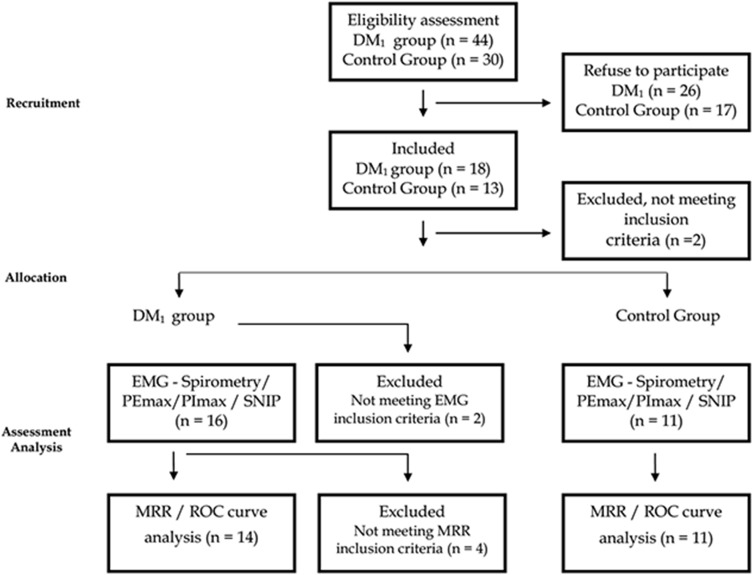
Design and methods: Quasi-experimental observational study with control group. MRR of inspiratory muscles, lung function and amplitude of the electromyographic activity of SCM, SCA, 2ndIS and RA muscles during maximum inspiratory pressure (PImax), maximum expiratory pressure (PEmax) and sniff nasal inspiratory pressure (SNIP) tests were assessed in eighteen DM1 subjects and eleven healthy.
Results: MRR was lower in DM1 group compared to healthy (P = 0.001) and was considered sensitive and specific to identify disease in DM1 and discard it in controls, as well as SNIP% (P = 0.0026), PImax% (P = 0.0077) and PEmax% (P = 0.0002). Contraction time of SCM and SCA was higher in DM1 compared to controls, respectively, during PImax (P = 0.023 and P = 0.017) and SNIP (P = 0.015 and P = .0004). The DM1 group showed lower PImax (P = .0006), PEmax (P = 0.0002), SNIP (P = 0.0014), and higher electromyographic activity of the SCM (P = 0.002) and SCA (P = 0.004) at rest; of 2ndIS (P = 0.003) during PEmax and of SCM (P = 0.02) and SCA (P = 0.03) during SNIP test.
Conclusions: MD1 subjects presented restrictive pattern, reduced respiratory muscle strength, muscular electrical activity and MRR when compared to higher compared to controls. In addition, the lower MRR found in MD1 subjects showed to be reliable to sensitivity and specificity in identifying the delayed relaxation of respiratory muscles.
Conflict of interest statement
Figures


Similar articles
-
Muscle impairment in neuromuscular disease using an expiratory/inspiratory pressure ratio.Respir Care. 2015 Apr;60(4):533-9. doi: 10.4187/respcare.03367. Epub 2015 Jan 13. Respir Care. 2015. PMID: 25587161
-
Characteristics of respiratory muscle involvement in myotonic dystrophy type 1.Neuromuscul Disord. 2020 Jan;30(1):17-27. doi: 10.1016/j.nmd.2019.10.011. Epub 2019 Nov 5. Neuromuscul Disord. 2020. PMID: 31839403
-
Genioglossus muscle activity during sniff and reverse sniff in healthy men.Exp Physiol. 2018 Dec;103(12):1656-1665. doi: 10.1113/EP086995. Epub 2018 Oct 17. Exp Physiol. 2018. PMID: 30242925
-
[Neuromuscular disorders - assessment of the respiratory muscles].Rev Neurol (Paris). 2006 Apr;162(4):437-44. doi: 10.1016/s0035-3787(06)75034-2. Rev Neurol (Paris). 2006. PMID: 16585904 Review. French.
-
Maximal Static Respiratory and Sniff Pressures in Healthy Children. A Systematic Review and Meta-Analysis.Ann Am Thorac Soc. 2019 Apr;16(4):478-487. doi: 10.1513/AnnalsATS.201808-506OC. Ann Am Thorac Soc. 2019. PMID: 30562038
Cited by
-
Diaphragm sniff ultrasound: Normal values, relationship with sniff nasal pressure and accuracy for predicting respiratory involvement in patients with neuromuscular disorders.PLoS One. 2019 Apr 24;14(4):e0214288. doi: 10.1371/journal.pone.0214288. eCollection 2019. PLoS One. 2019. PMID: 31017911 Free PMC article.
-
Endurance exercise leads to beneficial molecular and physiological effects in a mouse model of myotonic dystrophy type 1.Muscle Nerve. 2019 Dec;60(6):779-789. doi: 10.1002/mus.26709. Epub 2019 Oct 23. Muscle Nerve. 2019. PMID: 31509256 Free PMC article.
-
Clinical implication of maximal voluntary ventilation in myotonic muscular dystrophy.Medicine (Baltimore). 2019 May;98(18):e15321. doi: 10.1097/MD.0000000000015321. Medicine (Baltimore). 2019. PMID: 31045770 Free PMC article.
-
Multiparametric Analysis of Sniff Nasal Inspiratory Pressure Test in Middle Stage Amyotrophic Lateral Sclerosis.Front Neurol. 2018 May 2;9:306. doi: 10.3389/fneur.2018.00306. eCollection 2018. Front Neurol. 2018. PMID: 29770120 Free PMC article.
-
Methods to normalize surface electromyography in respiratory muscles: Is it similar between amyotrophic lateral sclerosis and healthy people?PLoS One. 2024 Dec 20;19(12):e0315846. doi: 10.1371/journal.pone.0315846. eCollection 2024. PLoS One. 2024. PMID: 39705260 Free PMC article.
References
-
- Flanigan KM. The muscular dystrophies. Semin Neurol. 2012;32(3):255–63. doi: 10.1055/s-0032-1329199 . - DOI - PubMed
-
- Smith AE, McMullen K, Jensen MP, Carter GT, Molton IR. Symptom burden in persons with myotonic and facioscapulohumeral muscular dystrophy. Am J Phys Med Rehabil. 2014;93(5):387–95. doi: 10.1097/PHM.0000000000000032 . - DOI - PMC - PubMed
-
- Emery AE. Population frequencies of inherited neuromuscular diseases—a world survey. Neur disor: NMD. 1991;1(1):19–29. . - PubMed
-
- Fregonezi G, Azevedo IG, Resqueti VR, De Andrade AD, Gualdi LP, Aliverti A, et al. Muscle impairment in neuromuscular disease using an expiratory/inspiratory pressure ratio. Respir Care. 2015;60(4):533–9. respcare.03367 [pii] doi: 10.4187/respcare.03367 . - DOI - PubMed
Publication types
MeSH terms
LinkOut - more resources
Full Text Sources
Other Literature Sources
