Application of the 3D slicer chest imaging platform segmentation algorithm for large lung nodule delineation
- PMID: 28594880
- PMCID: PMC5464594
- DOI: 10.1371/journal.pone.0178944
Application of the 3D slicer chest imaging platform segmentation algorithm for large lung nodule delineation
Abstract
Purpose: Accurate segmentation of lung nodules is crucial in the development of imaging biomarkers for predicting malignancy of the nodules. Manual segmentation is time consuming and affected by inter-observer variability. We evaluated the robustness and accuracy of a publically available semiautomatic segmentation algorithm that is implemented in the 3D Slicer Chest Imaging Platform (CIP) and compared it with the performance of manual segmentation.
Methods: CT images of 354 manually segmented nodules were downloaded from the LIDC database. Four radiologists performed the manual segmentation and assessed various nodule characteristics. The semiautomatic CIP segmentation was initialized using the centroid of the manual segmentations, thereby generating four contours for each nodule. The robustness of both segmentation methods was assessed using the region of uncertainty (δ) and Dice similarity index (DSI). The robustness of the segmentation methods was compared using the Wilcoxon-signed rank test (pWilcoxon<0.05). The Dice similarity index (DSIAgree) between the manual and CIP segmentations was computed to estimate the accuracy of the semiautomatic contours.
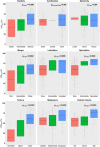
Results: The median computational time of the CIP segmentation was 10 s. The median CIP and manually segmented volumes were 477 ml and 309 ml, respectively. CIP segmentations were significantly more robust than manual segmentations (median δCIP = 14ml, median dsiCIP = 99% vs. median δmanual = 222ml, median dsimanual = 82%) with pWilcoxon~10-16. The agreement between CIP and manual segmentations had a median DSIAgree of 60%. While 13% (47/354) of the nodules did not require any manual adjustment, minor to substantial manual adjustments were needed for 87% (305/354) of the nodules. CIP segmentations were observed to perform poorly (median DSIAgree≈50%) for non-/sub-solid nodules with subtle appearances and poorly defined boundaries.
Conclusion: Semi-automatic CIP segmentation can potentially reduce the physician workload for 13% of nodules owing to its computational efficiency and superior stability compared to manual segmentation. Although manual adjustment is needed for many cases, CIP segmentation provides a preliminary contour for physicians as a starting point.
Conflict of interest statement
Figures


References
-
- Aerts HJWL, Velazquez ER, Leijenaar RTH, Parmar C, Grossmann P, Carvalho S, et al. Decoding tumour phenotype by noninvasive imaging using a quantitative radiomics approach. Nat Commun. 2014;5:4006 doi: 10.1038/ncomms5006 - DOI - PMC - PubMed
-
- Coroller TP, Agrawal V, Narayan V, Hou Y, Grossmann P, Lee SW, et al. Radiomic phenotype features predict pathological response in non-small cell lung cancer. Radiotherapy and Oncology. 2016;119(3):480–6. https://doi.org/10.1016/j.radonc.2016.04.004. doi: 10.1016/j.radonc.2016.04.004 - DOI - DOI - PMC - PubMed
-
- Torre LA, Bray F, Siegel RL, Ferlay J, Lortet-Tieulent J, Jemal A. Global cancer statistics, 2012. CA: A Cancer Journal for Clinicians. 2015;65(2):87–108. doi: 10.3322/caac.21262 - DOI - PubMed
-
- Association AL. Lung Cancer Fact Sheet. http://wwwlungorg/. 2016.
-
- Team TNLSTR. Reduced Lung-Cancer Mortality with Low-Dose Computed Tomographic Screening. New England Journal of Medicine. 2011;365(5):395–409. doi: 10.1056/NEJMoa1102873. . - DOI - PMC - PubMed
MeSH terms
Grants and funding
LinkOut - more resources
Full Text Sources
Other Literature Sources
Medical

