

Ellenberg's indicator values support prediction of suitable habitat for pre-diapause larvae of endangered butterfly Euphydryas aurinia
- PMID: 28594890
- PMCID: PMC5464623
- DOI: 10.1371/journal.pone.0179026
Ellenberg's indicator values support prediction of suitable habitat for pre-diapause larvae of endangered butterfly Euphydryas aurinia
Abstract
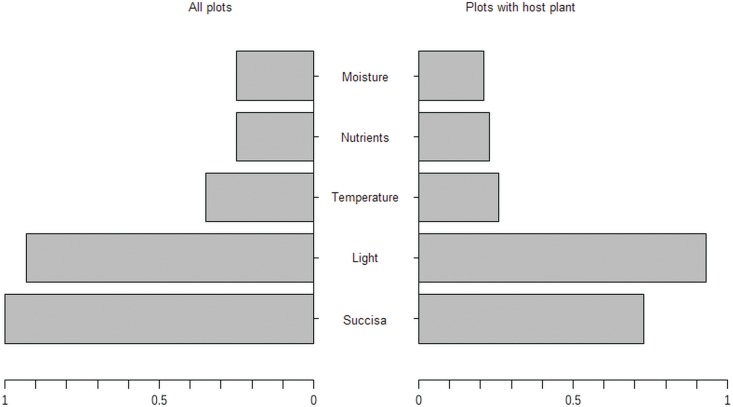
In spite of the great popularity of Ellenberg's Indicator Values (EIVs) in plant ecology, animal ecologists seldom use EIVs to address ecological questions. In this study we used EIVs to test their potential usefulness for the prediction of suitable habitat for pre-diapause larvae of the endangered butterfly species Euphydryas aurinia. Nine transects crossing grasslands in SW Poland with abundant populations of E. aurinia were designed. We sampled 76 vegetation plots along the transects. In addition, the presence of the larval webs of E. aurinia in sampled plots was also recorded. We then calculated the mean community EIVs of light, nitrogen, soil reaction, moisture and temperature for each sample plots. Generalized linear mixed-effects models (GLMMs) were used to assess which factors determine the local occurrence of larval webs of E. aurinia. We found the larval webs only in 12 plots, while the host plant was present in 39 of the examined plots. The presence of the host plant was the most important predictor in both models including all plots or including only plots with host plants. The other significant predictor was the mean EIV of light, and its importance increased in models considering all plots. We attributed the importance of the EIV of light to the site openness and density of the vegetation layer. A positive relationship between this predictor and the presence of larval webs indicates that sites with looser vegetation, a lower contribution of shrubs and tall herbs and better penetration of photosynthetically active radiation to lower vegetation layers are preferred by E. aurinia for oviposition. Moreover, the significance of EIV of light may be linked with management practices. Many light-demanding species decline after cessation of mowing as a result of litter accumulation and the dominance of tall herbs. An absence of light-demanding species decreases the community's mean EIV of light and thus indicates the influence of meadow abandonment.
Conflict of interest statement
Figures


References
-
- Durak T, Holeksa J. Biotic homogenisation and differentiation along a habitat gradient resulting from the ageing of managed beech stands. For Ecol Manag. 2015;351: 47–56. 10.1016/j.foreco.2015.05.001 - DOI
-
- Šebesta J, Šamonil P, Lacina J, Oulehle F, Houška J, Buček A. Acidification of primeval forests in the Ukraine Carpathians: Vegetation and soil changes over six decades. For Ecol Manag. 2011;262: 1265–1279. 10.1016/j.foreco.2011.06.024 - DOI
-
- Stevens CJ, Ceulemans T, Hodgson JG, Jarvis S, Grime JP, Smart SM. Drivers of vegetation change in grasslands of the Sheffield region, northern England, between 1965 and 2012/13. Hölzel N, editor. Appl Veg Sci. 2016;19: 187–195. 10.1111/avsc.12206 - DOI
-
- Škodová I, Janišová M, Hegedüšová K, Borsukevych L, Smatanová J, Kish R, et al. Sub-montane semi-natural grassland communities in the Eastern Carpathians (Ukraine). 2015;
-
- Zelený D, Schaffers AP. Too good to be true: pitfalls of using mean Ellenberg indicator values in vegetation analyses. Palmer M, editor. J Veg Sci. 2012;23: 419–431. 10.1111/j.1654-1103.2011.01366.x - DOI
MeSH terms
LinkOut - more resources
Full Text Sources
Other Literature Sources
