. 2017 Jun 8;12(6):e0178436.
doi: 10.1371/journal.pone.0178436. eCollection 2017.

Conophylline inhibits non-alcoholic steatohepatitis in mice

Affiliations

Conophylline inhibits non-alcoholic steatohepatitis in mice

Yukiomi Nakade et al. PLoS One. .

Abstract

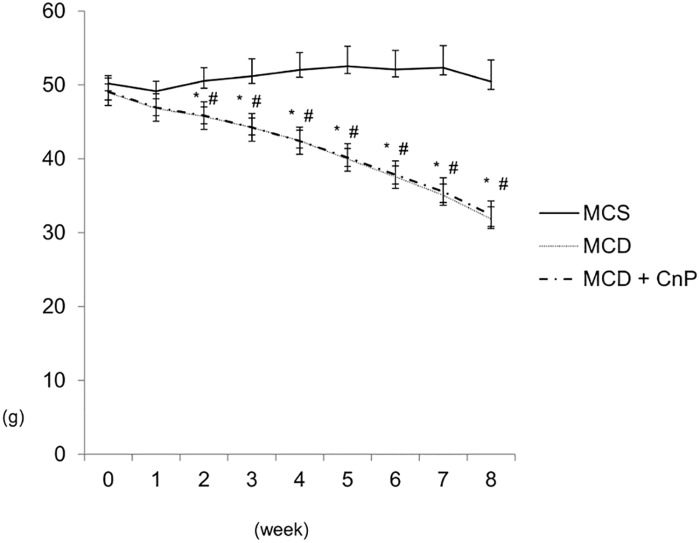
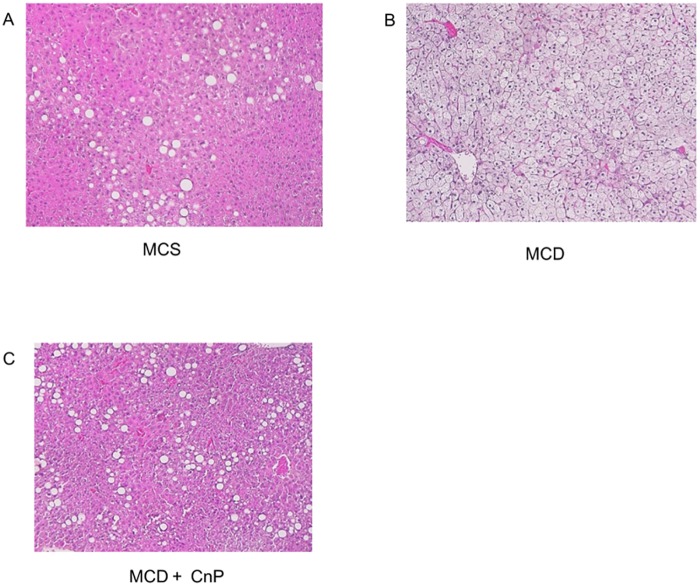
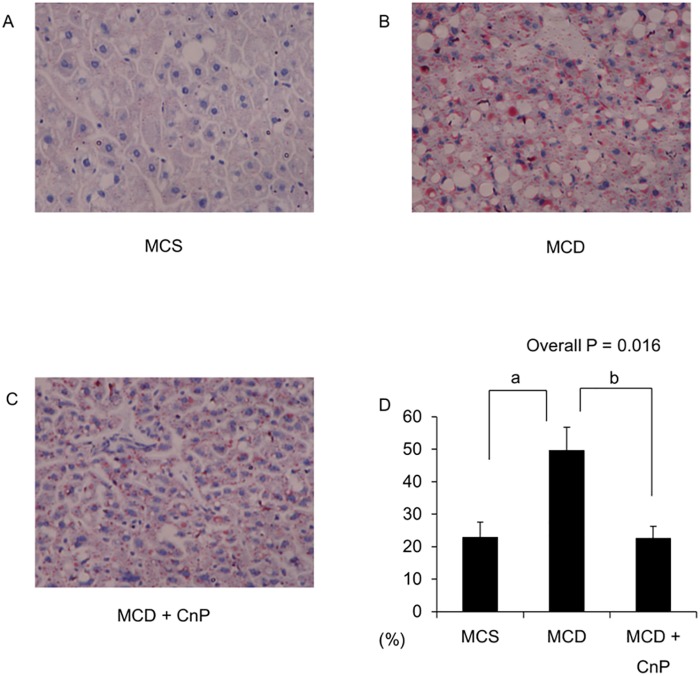
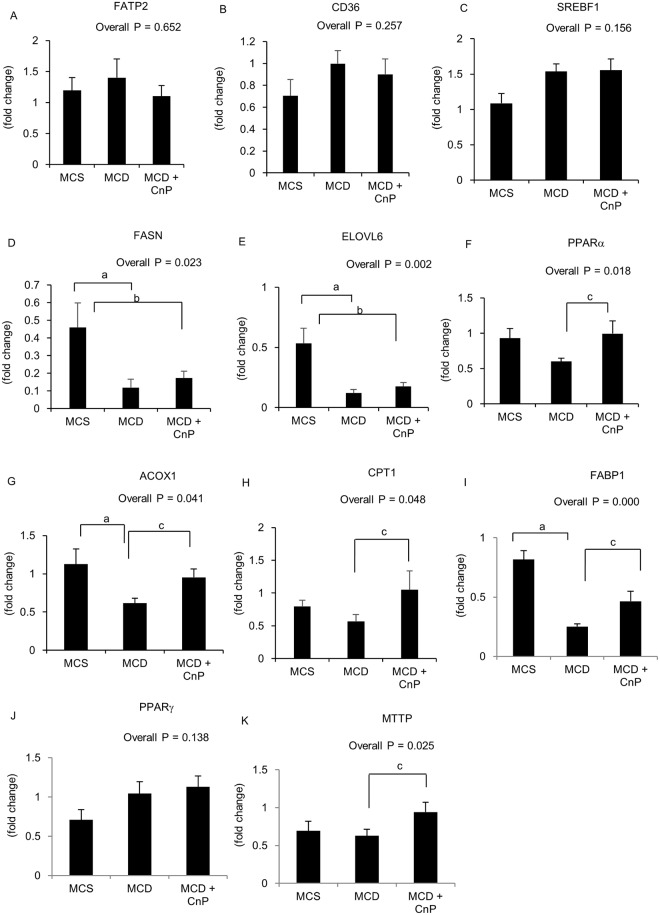
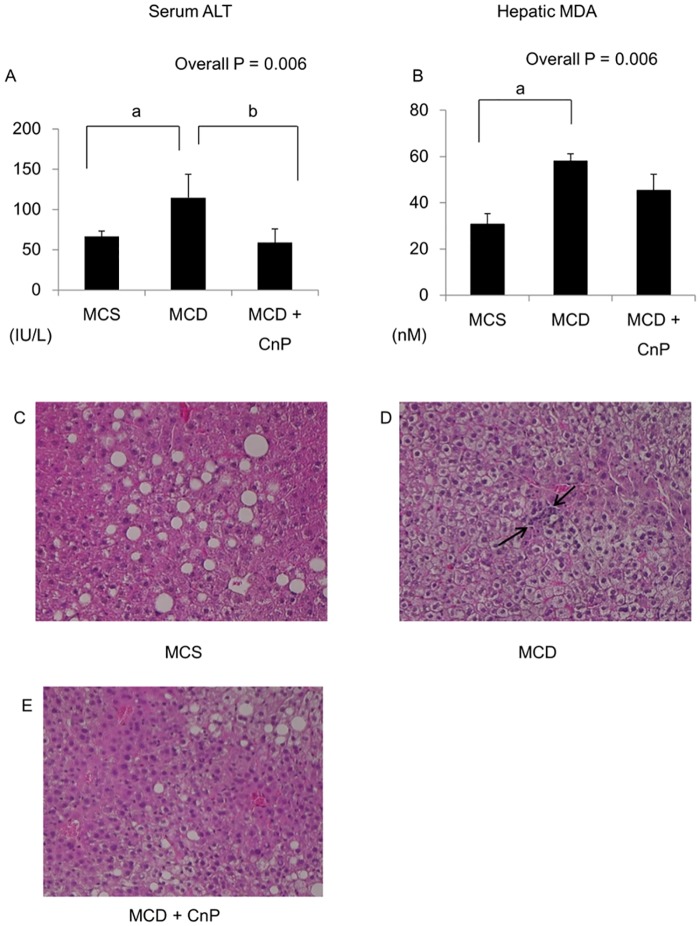
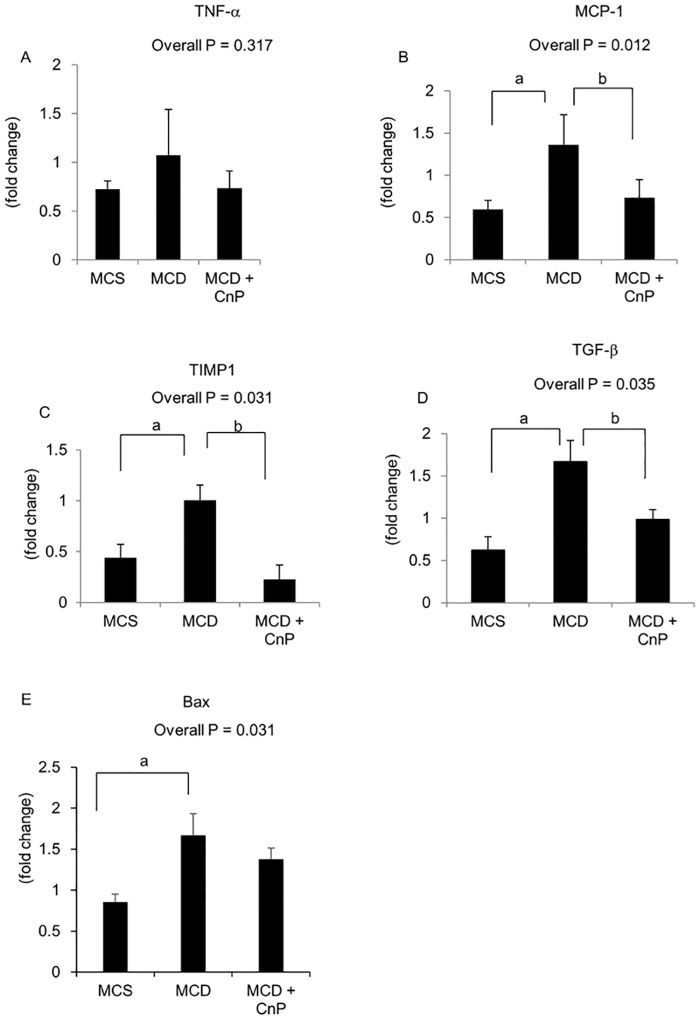
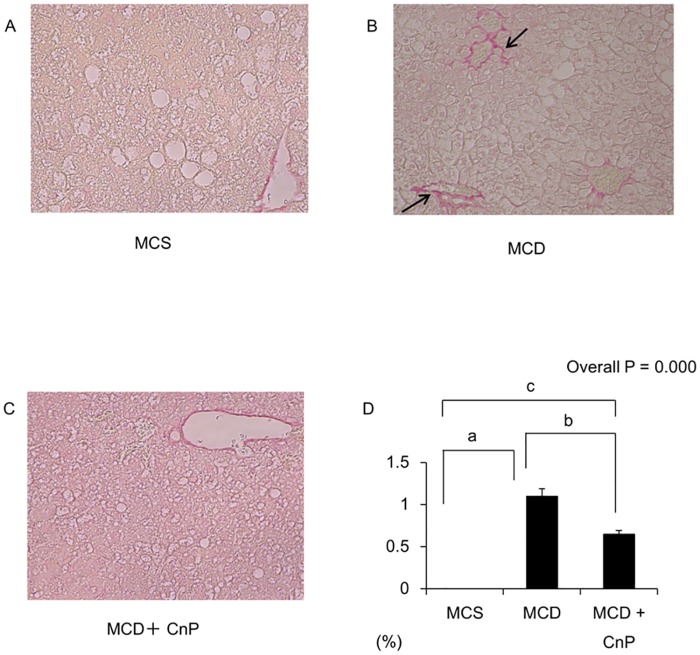
Conophylline (CnP), a vinca alkaloid extracted from the leaves of the tropical plant Ervatamia microphylla, attenuates hepatic fibrosis in mice. However, little is known about whether CnP inhibits steatosis, inflammation, and fibrosis in non-alcoholic steatohepatitis (NASH) in mice. A methionine-choline-deficient (MCD) diet was administered to male db/db mice as a NASH model, and CnP (1 μg/kg/d) was co-administered. Eight weeks after the commencement of the MCD diet, hepatic steatosis, inflammation, and fibrosis, and hepatic fat metabolism-, inflammation-, and fibrosis-related markers were examined. Feeding on an MCD for 8 weeks induced hepatic steatosis, inflammation, and fibrosis. CnP significantly attenuated the MCD-induced increases in hepatic steatosis, as well as hepatic inflammation and fibrosis. The MCD diet increased hepatic transforming growth factor-β (TGF-β) mRNA levels, which are correlated with hepatic steatosis, inflammation, and fibrosis. The diet also attenuated acyl-coenzyme A oxidase 1 (ACOX1) and carnitine palmitoyltransferase 1 (CPT1) mRNA levels, which are involved in β-oxidation. The putative mechanism of the CnP effect involves reduced hepatic TGF-β mRNA levels, and increased mRNA levels of hepatic peroxisome proliferator-activated receptor (PPAR) α and its target genes ACOX1 and CPT1. The results of this study indicate that CnP inhibits steatohepatitis, possibly through the inhibition of hepatic TGF-β mRNA levels, and induces an increase in PPARα mRNA levels, resulting in the attenuation of hepatic steatosis, inflammation, and fibrosis in mice. CnP might accordingly be a suitable therapeutic option for NASH.


Conflict of interest statement

Competing Interests: The authors declare that they have no competing interests.

Figures

Fig 1
Fig 1. Time course changes in body weight.
Mice were fed with a methionine-choline-sufficient (MCS, n = 5), methionine-choline-deficient (MCD, n = 6), or MCD with conophylline (CnP) (n = 6) diet. Statistical analysis was performed using ANOVA, and data are expressed as means ± SE. The overall P value was less than 0.05 from 2 weeks to 8 weeks (*P < 0.05, MCD diet compared to MCS diet; #P < 0.05, MCD diet with CnP compared to MCS diet).
Fig 2
Fig 2. Representative images of the liver stained with hematoxylin-eosin.
Mice were fed with a methionine-choline-sufficient (MCS) (A), methionine-choline-deficient (MCD) (B), or MCD with conophylline (CnP) (C) diet. Original magnification, ×100.
Fig 3
Fig 3. Representative images of liver stained with Oil Red O.
Mice were fed with a methionine-choline-sufficient MCS (A), methionine-choline-deficient (MCD) (B), or MCD with conophylline (CnP) diet (C). (D) Quantitative analysis of changes in Oil Red O-positive area in the respective groups. Statistical analysis was performed using ANOVA, and data are expressed as means ± SE (a P < 0.05 MCD diet compared to MCS diet, b P < 0.05 MCD diet with CnP compared to MCD diet). Original magnification, ×200.
Fig 4
Fig 4. Evaluation of hepatic lipid metabolism-related genes.
Mice were fed with a methionine-choline-sufficient (MCS), methionine-choline-deficient (MCD), or MCD with conophylline (CnP) diet. The relative mRNA expressions of FATP2 (A), CD36 (B), SREBF1 (C), FASN (D), ELOVL6 (E), PPARα (F), ACOX1 (G), CPT1 (H), FABP1 (I), MTTP (J), and PPARγ (K) were evaluated. Statistical analysis was performed using ANOVA, and data are expressed as means ± SE (a P < 0.05 MCD diet compared to MCS diet, b P < 0.05 MCD diet with CnP compared to MCS diet, c P < 0.05 MCD diet with CnP compared to MCD diet).
Fig 5
Fig 5. Evaluation of hepatic inflammation-related parameters.
Mice were fed with a methionine-choline-sufficient (MCS), methionine-choline-deficient (MCD), or MCD with conophylline (CnP) diet. (A) Serum alanine aminotransferase (ALT) levels. (B) Hepatic malondialdehyde (MDA) levels. Representative images showing the inflammatory foci for MCD-induced liver injury in mice (C: MCS, D: MCD, and E: MCD diet with CnP). Original magnification, ×200. The arrows indicate the inflammatory cells in the liver. (F) The number of inflammatory foci per ×20 field was enumerated for each section. Statistical analysis was performed using ANOVA, and data are expressed as means ± SE (a P < 0.05 MCD diet compared to MCS diet, b P < 0.05 MCD diet with CnP compared to MCD diet).
Fig 6
Fig 6. Evaluation of hepatic inflammation-related genes.
Mice were fed with a methionine-choline-sufficient (MCS), methionine-choline-deficient (MCD), or MCD with conophylline (CnP) diet. Relative mRNA expressions of TNF-α (A), MCP-1 (B), TGF-β (C), TIMP1 (D), and Bax (E) were evaluated in the liver. Statistical analysis was performed using ANOVA, and data are expressed as means ± SE (a P < 0.05 MCD diet compared to MCS diet, b P < 0.05 MCD diet with CnP compared to MCD diet).
Fig 7
Fig 7. Representative images of the liver stained with Sirius Red.
Mice were fed with a methionine-choline-sufficient (MCS) (A), methionine-choline-deficient (MCD) (B), or MCD with conophylline (CnP) (C) diet. (D) Quantitative analysis of changes in Sirius red-positive area in the respective groups. The arrows indicate the fibrotic collagen fibers in the liver, Original magnification, ×200. Statistical analysis was performed using ANOVA, and data are expressed as means ± SE (a P < 0.05 MCD diet compared to MCS diet, b P < 0.05 MCD diet with CnP compared to MCD diet, c P < 0.05 MCD diet with CnP compared to MCS diet).

References

    1. Adams LA, Waters OR, Knuiman MW, Elliott RR, Olynyk JK. NAFLD as a risk factor for the development of diabetes and the metabolic syndrome: an eleven-year follow-up study. Am J Gastroenterol. 2009;104(4):861–7. Epub 2009/03/19. 10.1038/ajg.2009.67 . - DOI - PubMed
    1. Lazo M, Clark JM. The epidemiology of nonalcoholic fatty liver disease: a global perspective. Semin Liver Dis. 2008;28(4):339–50. 10.1055/s-0028-1091978 - DOI - PubMed
    1. Almeda-Valdes P, Cuevas-Ramos D, Aguilar-Salinas CA. Metabolic syndrome and non-alcoholic fatty liver disease. Ann Hepatol. 2009;8 Suppl 1:S18–24. . - PubMed
    1. Eckel RH, Alberti KG, Grundy SM, Zimmet PZ. The metabolic syndrome. Lancet. 2010;375(9710):181–3. 10.1016/S0140-6736(09)61794-3 . - DOI - PubMed
    1. Ong JP, Younossi ZM. Epidemiology and natural history of NAFLD and NASH. Clin Liver Dis. 2007;11(1):1–16, vii Epub 2007/06/05. 10.1016/j.cld.2007.02.009 . - DOI - PubMed

MeSH terms