

Pneumococcal Capsule Synthesis Locus cps as Evolutionary Hotspot with Potential to Generate Novel Serotypes by Recombination
- PMID: 28595308
- PMCID: PMC5850285
- DOI: 10.1093/molbev/msx173
Pneumococcal Capsule Synthesis Locus cps as Evolutionary Hotspot with Potential to Generate Novel Serotypes by Recombination
Abstract
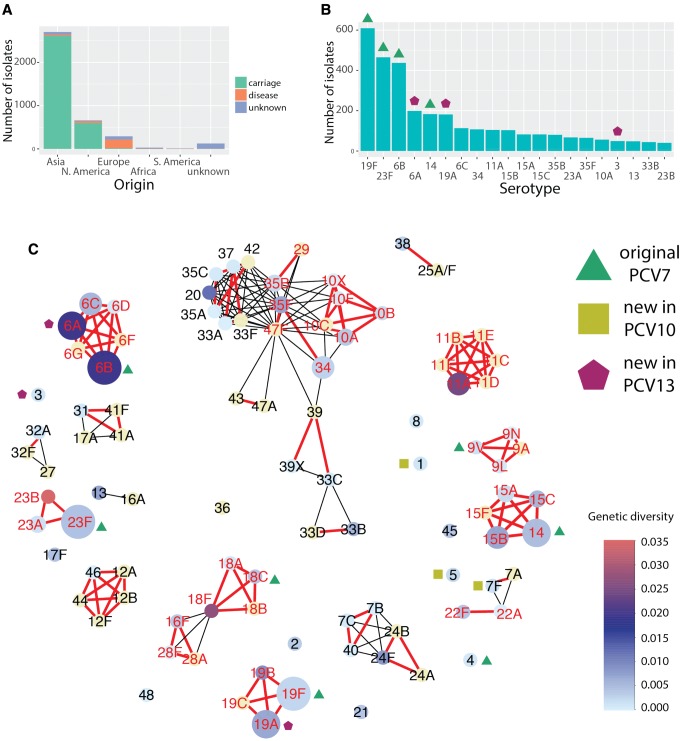
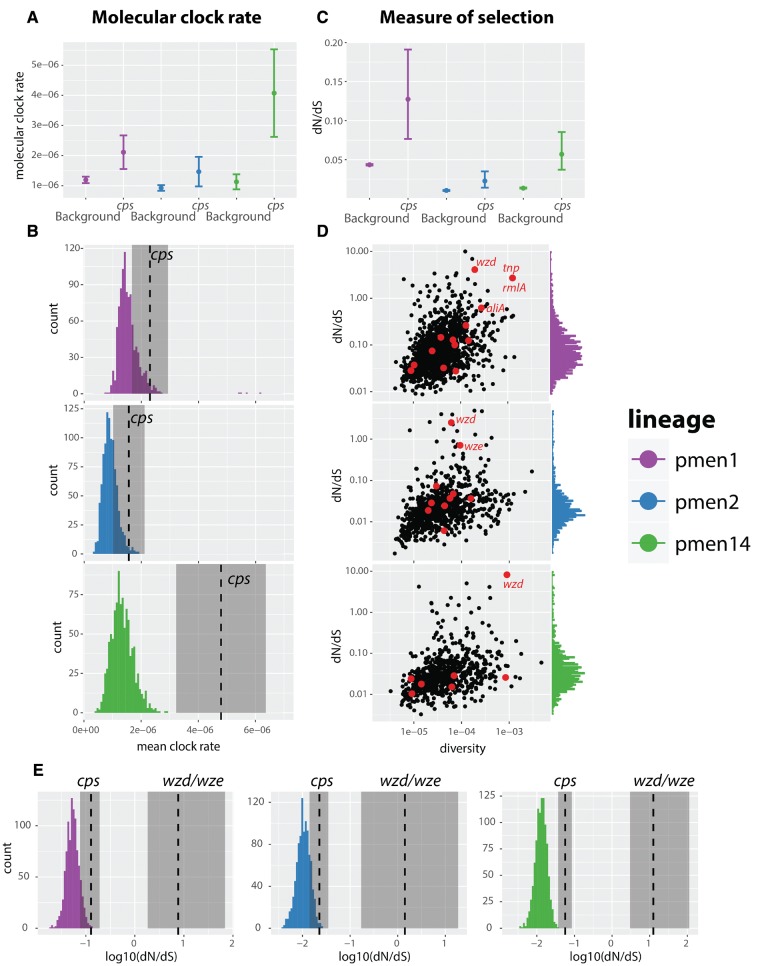
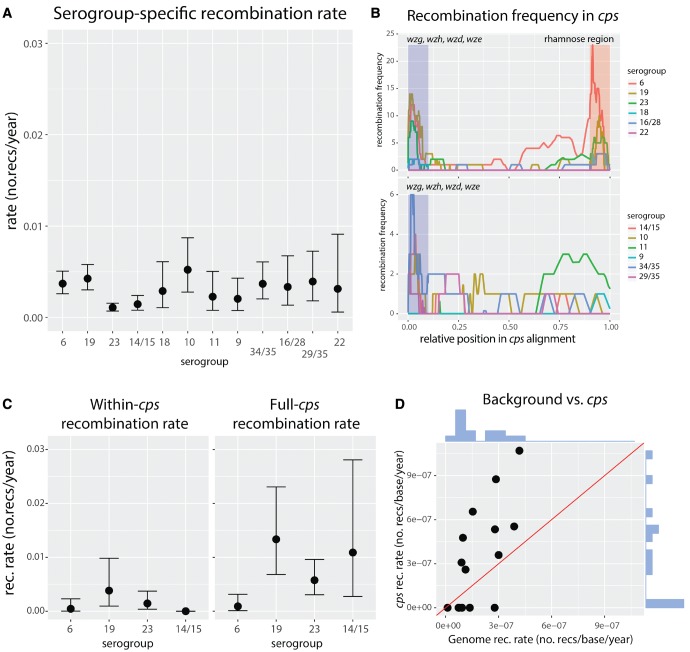
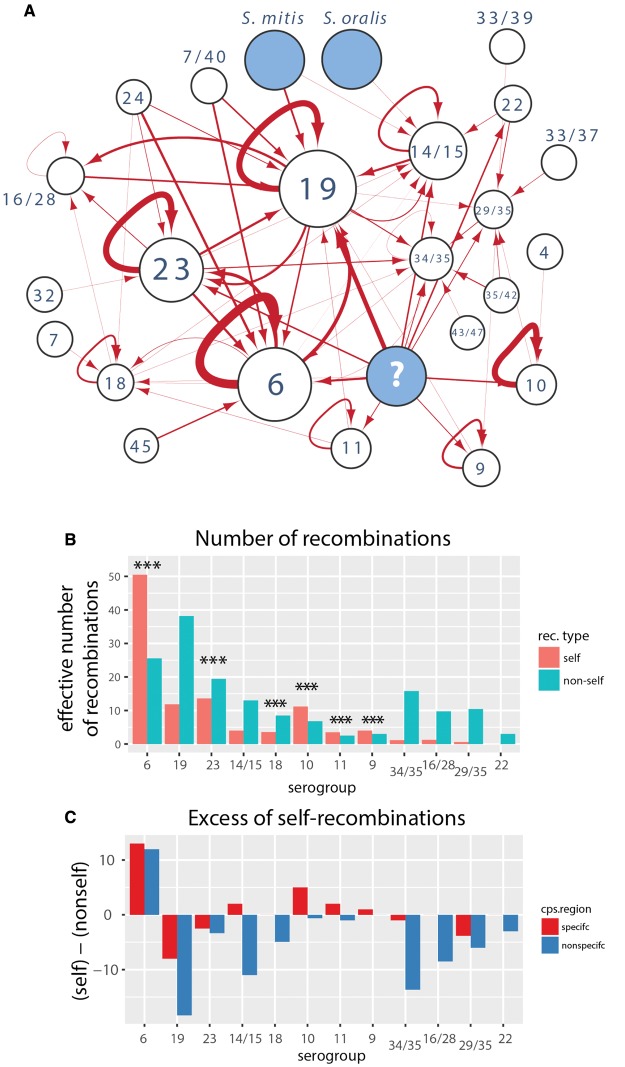
Diversity of the polysaccharide capsule in Streptococcus pneumoniae-main surface antigen and the target of the currently used pneumococcal vaccines-constitutes a major obstacle in eliminating pneumococcal disease. Such diversity is genetically encoded by almost 100 variants of the capsule biosynthesis locus, cps. However, the evolutionary dynamics of the capsule remains not fully understood. Here, using genetic data from 4,519 bacterial isolates, we found cps to be an evolutionary hotspot with elevated substitution and recombination rates. These rates were a consequence of relaxed purifying selection and positive, diversifying selection acting at this locus, supporting the hypothesis that the capsule has an increased potential to generate novel diversity compared with the rest of the genome. Diversifying selection was particularly evident in the region of wzd/wze genes, which are known to regulate capsule expression and hence the bacterium's ability to cause disease. Using a novel, capsule-centered approach, we analyzed the evolutionary history of 12 major serogroups. Such analysis revealed their complex diversification scenarios, which were principally driven by recombination with other serogroups and other streptococci. Patterns of recombinational exchanges between serogroups could not be explained by serotype frequency alone, thus pointing to nonrandom associations between co-colonizing serotypes. Finally, we discovered a previously unobserved mosaic serotype 39X, which was confirmed to carry a viable and structurally novel capsule. Adding to previous discoveries of other mosaic capsules in densely sampled collections, these results emphasize the strong adaptive potential of the bacterium by its ability to generate novel antigenic diversity by recombination.
Keywords: conjugate vaccine; epidemiology; evolutionary dynamics; next-generation sequencing; pneumococcal disease; polysaccharide diversity.
© The Author 2017. Published by Oxford University Press on behalf of the Society for Molecular Biology and Evolution.
Figures

Similar articles
-
Putatively novel serotypes and the potential for reduced vaccine effectiveness: capsular locus diversity revealed among 5405 pneumococcal genomes.Microb Genom. 2016 Oct 1;2(10):000090. doi: 10.1099/mgen.0.000090. Microb Genom. 2016. PMID: 28133541 Free PMC article.
-
Identification and genetic engineering of pneumococcal capsule-like polysaccharides in commensal oral streptococci.Microbiol Spectr. 2024 Apr 2;12(4):e0188523. doi: 10.1128/spectrum.01885-23. Epub 2024 Mar 15. Microbiol Spectr. 2024. PMID: 38488366 Free PMC article.
-
A New Pneumococcal Capsule Type, 10D, is the 100th Serotype and Has a Large cps Fragment from an Oral Streptococcus.mBio. 2020 May 19;11(3):e00937-20. doi: 10.1128/mBio.00937-20. mBio. 2020. PMID: 32430472 Free PMC article.
-
Streptococcus pneumoniae Capsular Polysaccharide.Microbiol Spectr. 2019 Mar;7(2):10.1128/microbiolspec.gpp3-0019-2018. doi: 10.1128/microbiolspec.GPP3-0019-2018. Microbiol Spectr. 2019. PMID: 30977464 Free PMC article. Review.
-
Nonencapsulated Streptococcus pneumoniae: Emergence and Pathogenesis.mBio. 2016 Mar 22;7(2):e01792. doi: 10.1128/mBio.01792-15. mBio. 2016. PMID: 27006456 Free PMC article. Review.
Cited by
-
A Narrative Review of the Molecular Epidemiology and Laboratory Surveillance of Vaccine Preventable Bacterial Meningitis Agents: Streptococcus pneumoniae, Neisseria meningitidis, Haemophilus influenzae and Streptococcus agalactiae.Microorganisms. 2021 Feb 22;9(2):449. doi: 10.3390/microorganisms9020449. Microorganisms. 2021. PMID: 33671611 Free PMC article. Review.
-
Comparative genomics of invasive Streptococcus pneumoniae CC320/271 serotype 19F/19A before the introduction of pneumococcal vaccine in India.Mol Biol Rep. 2021 Apr;48(4):3265-3276. doi: 10.1007/s11033-021-06353-6. Epub 2021 Apr 19. Mol Biol Rep. 2021. PMID: 33876375
-
Identification of Pneumococcal Serotypes by PCR-Restriction Fragment Length Polymorphism.Diagnostics (Basel). 2019 Nov 18;9(4):196. doi: 10.3390/diagnostics9040196. Diagnostics (Basel). 2019. PMID: 31752204 Free PMC article.
-
Emerging Roles of Extracellular Vesicles in Pneumococcal Infections: Immunomodulators to Potential Novel Vaccine Candidates.Front Cell Infect Microbiol. 2022 Feb 14;12:836070. doi: 10.3389/fcimb.2022.836070. eCollection 2022. Front Cell Infect Microbiol. 2022. PMID: 35237534 Free PMC article. Review.
-
Experimental Evolution In Vivo To Identify Selective Pressures during Pneumococcal Colonization.mSystems. 2020 May 12;5(3):e00352-20. doi: 10.1128/mSystems.00352-20. mSystems. 2020. PMID: 32398278 Free PMC article.
References
Publication types
MeSH terms
Substances
Associated data
Grants and funding
LinkOut - more resources
Full Text Sources
Other Literature Sources
