. 2017 Sep 1;26(17):3327-3341.
doi: 10.1093/hmg/ddx217.

Mitochondrial dysfunction underlies cognitive defects as a result of neural stem cell depletion and impaired neurogenesis

Affiliations

Mitochondrial dysfunction underlies cognitive defects as a result of neural stem cell depletion and impaired neurogenesis

Mireille Khacho et al. Hum Mol Genet. .

Abstract

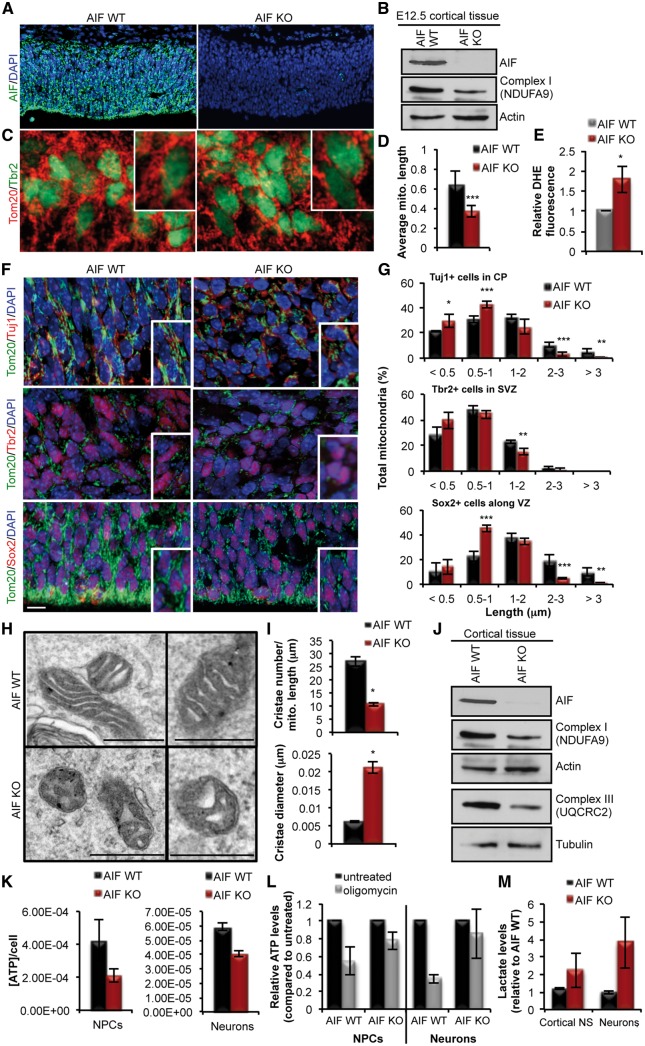
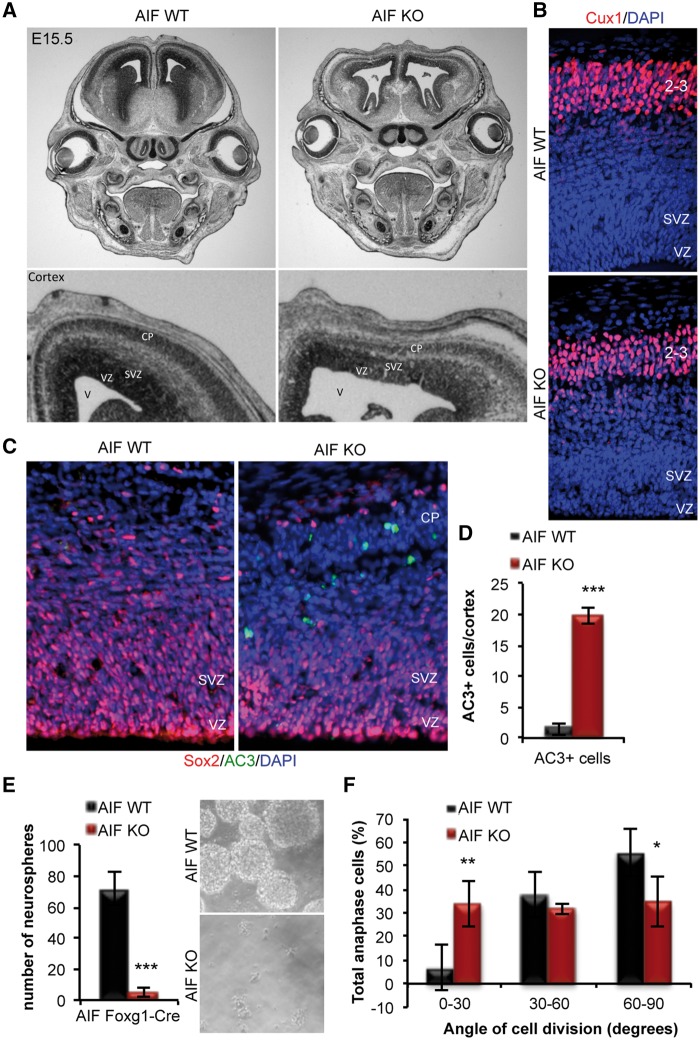
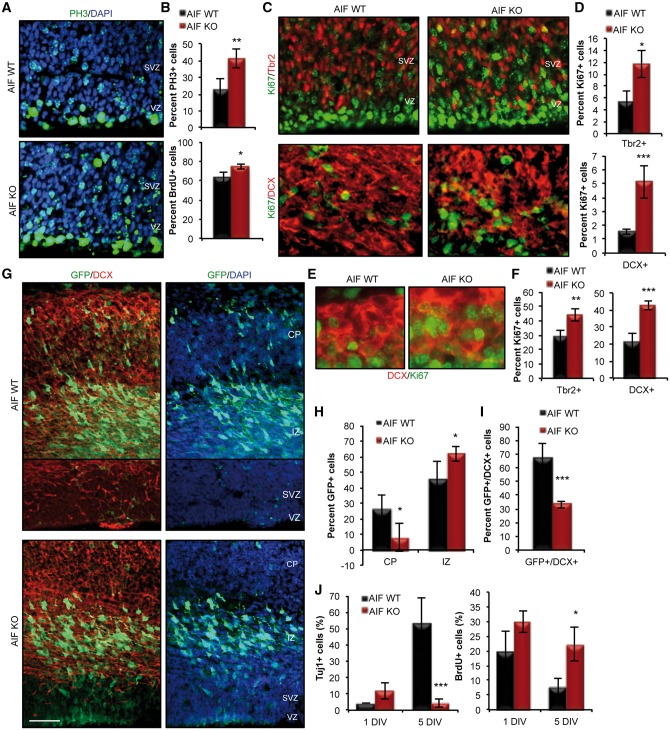
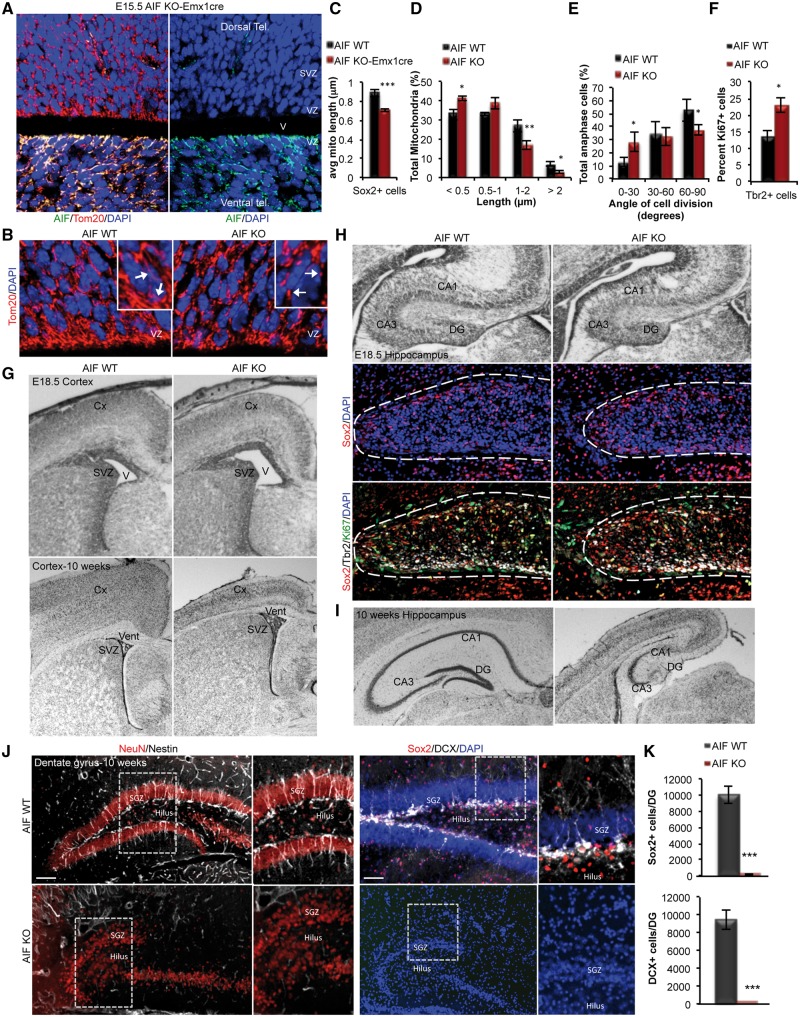
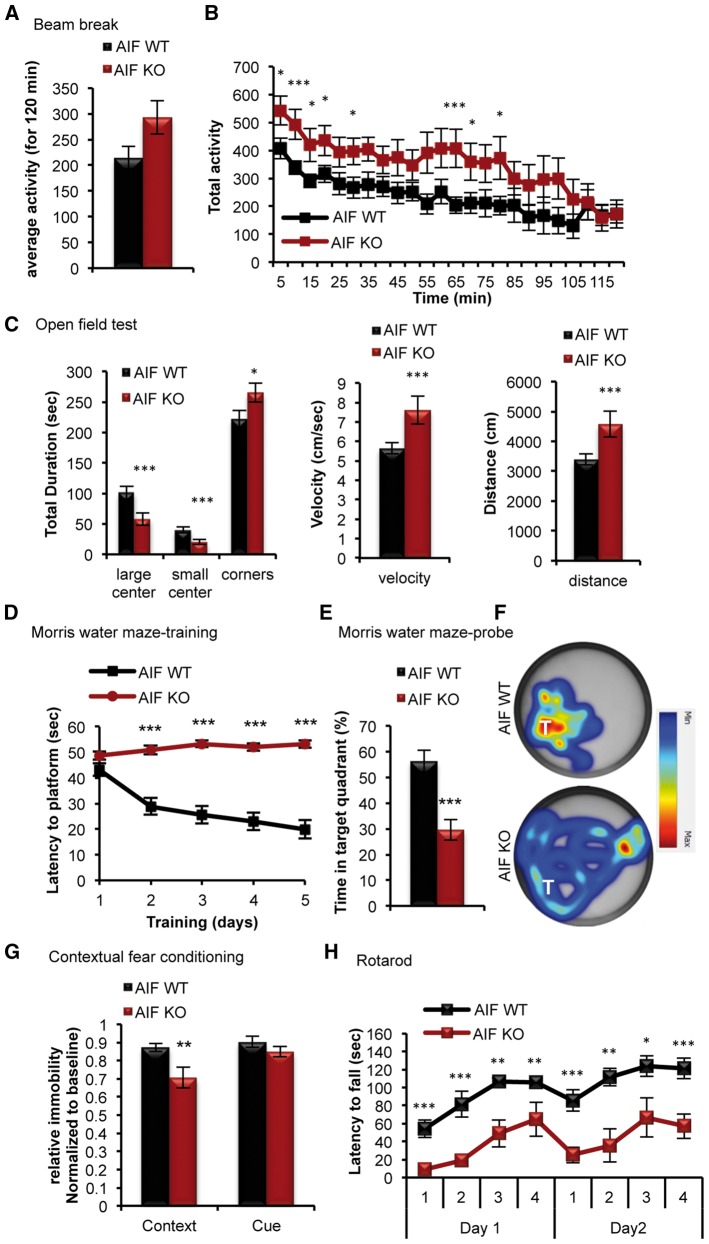
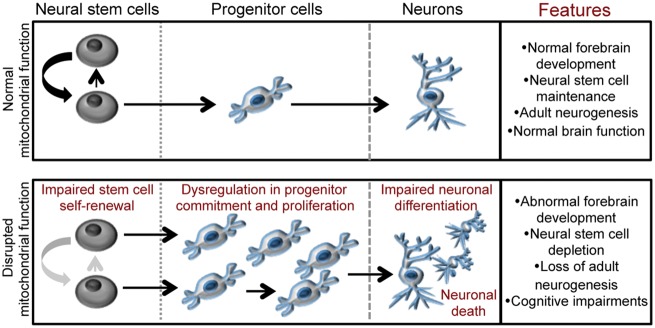
Mitochondrial dysfunction is a common feature of many genetic disorders that target the brain and cognition. However, the exact role these organelles play in the etiology of such disorders is not understood. Here, we show that mitochondrial dysfunction impairs brain development, depletes the adult neural stem cell (NSC) pool and impacts embryonic and adult neurogenesis. Using deletion of the mitochondrial oxidoreductase AIF as a genetic model of mitochondrial and neurodegenerative diseases revealed the importance of mitochondria in multiple steps of the neurogenic process. Developmentally, impaired mitochondrial function causes defects in NSC self-renewal, neural progenitor cell proliferation and cell cycle exit, as well as neuronal differentiation. Sustained mitochondrial dysfunction into adulthood leads to NSC depletion, loss of adult neurogenesis and manifests as a decline in brain function and cognitive impairment. These data demonstrate that mitochondrial dysfunction, as observed in genetic mitochondrial and neurodegenerative diseases, underlies the decline of brain function and cognition due to impaired stem cell maintenance and neurogenesis.


Figures

Figure 1.
Figure 1.
Conditional deletion of AIF causes loss of mitochondrial function in committed and uncommitted cells of the developing cortex. (A and B) Immunofluorescence and immunoblot analysis of AIF loss of expression in the cortex of E12.5 AIF-Foxg1Cre embryos compared to littermate controls. In (B) note the decreased expression of NDUFA9 (Complex 1) upon deletion of AIF. (C) Representative confocal images of mitochondrial morphology in coronal sections of AIF control or knockout brains at E12.5. Mitochondria and NPCs were visualized by Tom20 and Tbr2 immunostaining, respectively. (D) Average mitochondrial length measurements in AIF control and knockout cortices at E12.5. Represented as mean and SD (n = 3 independent samples). (E) Increased cytoplasmic ROS levels in AIF-KO E12.5 cortical tissue relative to AIF littermate controls as measured by DHE fluorescence. (F) Representative confocal images of mitochondrial morphology in coronal sections of AIF control and knockout E15.5 developing cortex. Mitochondria were visualized by Tom20 and different cell populations during neurogenesis were visualized by immunostaining for Sox2 (uncommitted cells that contain NSCs), Tbr2 (committed progenitor cells) and Tuj1 (post-mitotic differentiated neurons). Insets represent zoomed views of mitochondria. Scale = 10 μm (VZ and SVZ; ventricular and subventricular zones, CP; cortical plate). (G) Mitochondrial length from (F) was quantified and binned into different length categories. Represented as mean and SD (n = 3 independent samples). (H) Representative EM images of mitochondrial ultrastructure from the indicated genotypes. Scale = 500 nm. (I) Cristae number and diameter from (H) were quantified and represented as mean and s.e.m. (J) Expression levels of components of Complex I and III of the ETC derived from AIF control and knockout cortical tissue at E15.5. (K) ATP measurements in NPCs and neurons cultured from AIF control and knockout cortical tissue at E15.5. Data represented as mean and s.e.m. (n = 4 for control; n = 6 for AIF KO). (L) ATP measurements relative to initial values (black) following 1-h oligomycin treatment (grey) in cultured NPCs and neurons from E15.5 cortical tissue. Mean and SD (n = 4 independent samples). (M) Lactate levels measured from similar conditions as (K). Mean and SD (n = 3 for control, n = 5 for AIF KO). *P < 0.05; **P < 0.01; ***P < 0.001 (Student’s t-test).
Figure 2.
Figure 2.
Impairment in mitochondrial function causes defects in neural stem cell self-renewal. (A) Representative images from coronal sections of E15.5 AIF control or knockout heads subjected to cresyl violet staining. (B) Representative images of E15.5 AIF control and knockout cortices stained with DAPI and Cux1, a marker of layer 2/3 neurons. (C and D) Representative confocal images of apoptotic cells (AC3 immunofluorescence) in E15.5 coronal sections from AIF control and knockout embryos. No co-localization of AC3 was observed in Sox2+ NPCs. Total number of AC3+ cells was counted in the entire cortex and graphed as mean and SD (n = 3 independent samples). (E) Primary neurosphere assay performed on cells derived from the dorsal cortex of E15.5 control and AIF knockout embryos. Data presented as mean and SD (n = 5 independent experiments). Representative phase images of neurospheres. (F) Measurements of the division angle of Sox2+ anaphase cells in coronal sections from E15.5 AIF control or knockouts. Mitotic spindle pole orientation of dividing uncommitted cells is associated with asymmetric versus symmetric divisions and cell fate determination. Horizontal (0–30°) and intermediate (30–60°) cleavage angles (yellow line), relative to the apical surface of the lateral vertical (LV, white line), correlate with asymmetric divisions, while vertical (60–90°) cleavage angles correlate with symmetric divisions. Chromatin was visualized by DAPI staining. Angles were measured, binned and presented as mean and SD (n = 3 individual samples). *P < 0.05; **P < 0.01; ***P < 0.001 (Student’s t-test).
Figure 3.
Figure 3.
Mitochondrial dysfunction impairs multiple steps in the neurogenic process during cortical development. (A and B) Representative confocal images and quantification of proliferation of NPCs in E15.5 control and AIF knockouts using PH3 (phosphohistone 3; M-phase marker) and BrdU (S-phase marker) labeling. Data presented as mean and SD (n = 3 independent samples). (C and D) Representative confocal images and quantification of Tbr2+ progenitors and DCX+ neuroblasts co-labeled with Ki67 (proliferation marker) in E15.5 control and AIF knockouts. Data presented as mean and SD (n = 3 independent samples). (E and F) Representative confocal images and quantification of Tbr2+ progenitors and DCX+ neuroblasts co-labeled with Ki67 in E12.5 control and AIF knockouts. Data presented as mean and SD (n = 3 independent samples). (G–I) Representative confocal images following 48 h of in utero electroporation of GFP at E13.5 in the dorsal forebrain of control and AIF knockouts. Scale = 50 μm. Quantification of GFP+ cells based on location within the dorsal cortex (F) and co-labeling with DCX (G). Results are represented as mean and SD (n = 3 independent samples). (J) AIF control and knockout cells derived from E15.5 dorsal cortex were plated as monolayers and subjected to an in vitro differentiation assay. Cells were exposed to a 1-h BrdU pulse prior to fixation at 1 and 5 days in vitro (DIV). Data presented as mean and SD (n = 3 independent samples). *P < 0.05; **P < 0.01; ***P < 0.001 (Student’s t-test).
Figure 4.
Figure 4.
Loss of mitochondrial function causes age-dependent defects in forebrain development, depletion of NSCs and loss of adult neurogenesis in the DG. (A) Representative confocal images showing loss of AIF expression restricted to the dorsal cortex in AIF-Emx1Cre E15.5 embryos. (B) Representative confocal images of mitochondrial morphology in coronal sections of AIF control and knockout E15.5 developing cortex. Mitochondria were visualized by Tom20 and insets represent zoomed views of mitochondria. (VZ; ventricular zone). (C and D) Average mitochondrial length and mitochondrial length distribution from (B) was quantified and represented as mean and SD (n = 3 independent samples). (E) Measurements of the division angle of Sox2+ anaphase cells in E15.5 coronal sections for the indicated genotypes and presented as mean and SD (n = 3 individual samples). (F) Quantification of DCX+ neuroblasts co-labeled with Ki67 (proliferation marker) in E15.5 control and AIF knockouts. Data presented as mean and SD (n = 3 independent samples). (G) Cresyl violet stained coronal sections of E18.5 and 10-week adults with the indicated genotypes showing the cortex. (V; ventricle, SVZ; subventricular zones, Cx; cortex). (H and I) Cresyl violet stained coronal sections of E18.5 and 10-week adults showing the hippocampus. Representative confocal immunofluorescence images demonstrate zoomed views of the DG at E18.5 containing NPCs (Sox2 and Tbr2 labelled cells) (DG; dentate gyrus, vent; ventricle, svz; subventricular zones, Cx; cortex). (J and K) Representative confocal images of 10-week control and AIF knockout coronal sections of the dentate gyrus (DG) immunostained with Sox2 and Nestin (uncommitted cells), DCX (neuroblasts) and NeuN (mature neurons). Total Sox2+ and DCX+ cells in the entire DG was quantified and presented as mean and SD (n = 3 individual samples). Scale = 100 μm. *P < 0.05; ***P < 0.001 (Student’s t-test).
Figure 5.
Figure 5.
Mitochondrial dysfunction results in motor and cognitive deficits in adult mice. (A and B) Measurement of the overall activity of AIF-Emx1Cre knockouts and their littermate controls using the Beam break test at 10 weeks of age. Data presented as mean and s.e.m (using a 2-way repeated measures ANOVA Bonferroni post-hoc test). (n = 20 for control, n = 14 AIF KO). (C) Measurement of locomotor activity using the open field test. (D–G) Adult control and AIF knockout animals were subjected to hippocampal-dependent cognitive testing using the Morris water maze (D–F) and contextual fear conditioning (G). Data in (D) shows the Morris water maze training and data in (E) and (F) show the Morris water maze probe test at 11 weeks of age. For (D) data presented as mean and s.e.m (using a 2-way repeated measures ANOVA Bonferroni post-hoc test). For (E and G) data presented as mean and SD (using Student’s t-test). (H) Graph showing the daily measurement of motor function by the rotorod test at 12 weeks of age in control and AIF-Emx1Cre knockout animals. Data presented as mean and s.e.m (using a 2-way repeated measures ANOVA Bonferroni post-hoc test). *P < 0.05; **P < 0.01; ***P < 0.001 (Student’s t-test).
Figure 6.
Figure 6.
Mitochondrial function regulates the neurogenic process and is required for neural stem cell maintenance, neurogenesis and cognitive function. The cartoon depicts how the disruption of mitochondrial function within the uncommitted population of neural stem cells, as would occur in genetic mitochondrial-related disorders and neurodegenerative diseases, leads to defects in several steps of neurogenesis, including neural stem cell self-renewal and commitment, progenitor proliferation and neuronal differentiation. These defects culminate into abnormal brain development, depletion of the adult neural stem cell pool, loss of neurogenesis and cognitive defects.

References

    1. Khacho M., Slack R.S. (2015) Mitochondrial dynamics in neurodegeneration: from cell death to energetic states. AIMS Mol. Sci., 2, 161–174.
    1. Nunnari J., Suomalainen A. (2012) Mitochondria: in sickness and in health. Cell, 148, 1145–1159. - PMC - PubMed
    1. Lin M.T., Beal M.F. (2006) Mitochondrial dysfunction and oxidative stress in neurodegenerative diseases. Nature, 443, 787–795. - PubMed
    1. Khacho M., Clark A., Svoboda D.S., Azzi J., MacLaurin J.G., Meghaizel C., Sesaki H., Lagace D.C., Germain M., Harper M.E.. et al. (2016) Mitochondrial dynamics impacts stem cell identity and fate decisions by regulating a nuclear transcriptional program. Cell Stem Cell, 19, 232–247. - PubMed
    1. Hu C., Fan L., Cen P., Chen E., Jiang Z., Li L. (2016) Energy metabolism plays a critical role in stem cell maintenance and differentiation. Int. J. Mol. Sci., 17, 253. - PMC - PubMed

Publication types

Substances

Grants and funding