. 2017 Jun 8;18(1):456.
doi: 10.1186/s12864-017-3833-0.

Plant pectin acetylesterase structure and function: new insights from bioinformatic analysis

Affiliations

Plant pectin acetylesterase structure and function: new insights from bioinformatic analysis

Florian Philippe et al. BMC Genomics. .

Abstract

Background: Pectins are plant cell wall polysaccharides that can be acetylated on C2 and/or C3 of galacturonic acid residues. The degree of acetylation of pectin can be modulated by pectin acetylesterase (EC 3.1.1.6, PAE). The function and structure of plant PAEs remain poorly understood and the role of the fine-tuning of pectin acetylation on cell wall properties has not yet been elucidated.

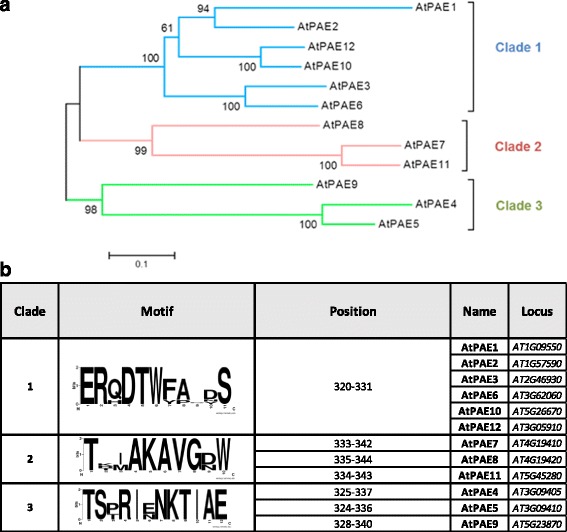
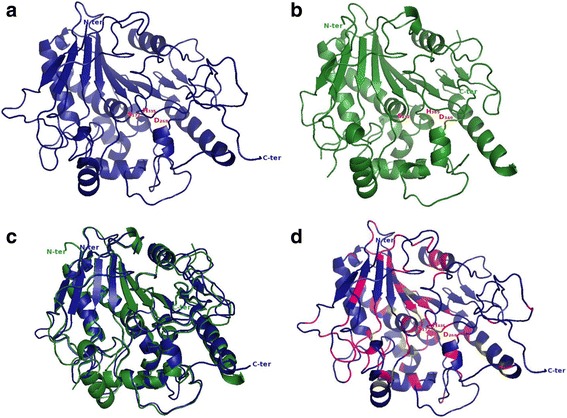
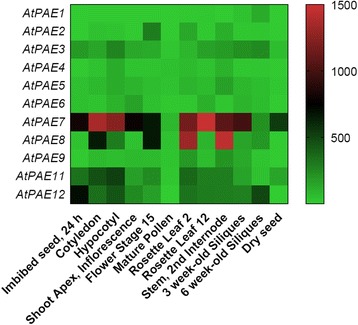
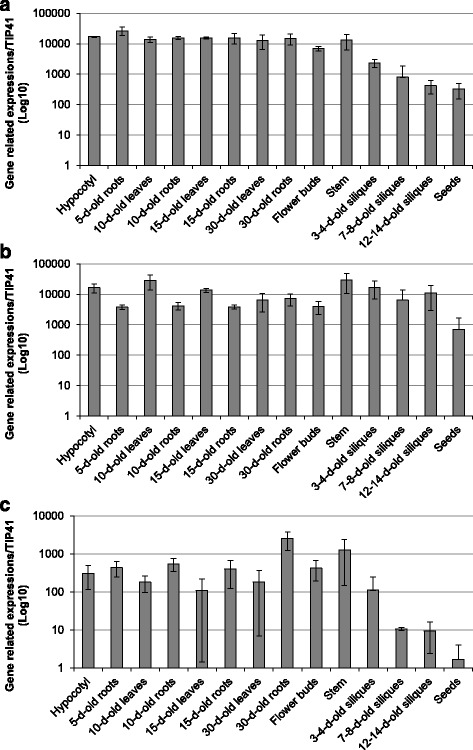
Results: In the present study, a bioinformatic approach was used on 72 plant PAEs from 16 species among 611 plant PAEs available in plant genomic databases. An overview of plant PAE proteins, particularly Arabidopsis thaliana PAEs, based on phylogeny analysis, protein motif identification and modeled 3D structure is presented. A phylogenetic tree analysis using protein sequences clustered the plant PAEs into five clades. AtPAEs clustered in four clades in the plant kingdom PAE tree while they formed three clades when a phylogenetic tree was performed only on Arabidopsis proteins, due to isoform AtPAE9. Primitive plants that display a smaller number of PAEs clustered into two clades, while in higher plants, the presence of multiple members of PAE genes indicated a diversification of AtPAEs. 3D homology modeling of AtPAE8 from clade 2 with a human Notum protein showed an α/β hydrolase structure with the hallmark Ser-His-Asp of the active site. A 3D model of AtPAE4 from clade 1 and AtPAE10 from clade 3 showed a similar shape suggesting that the diversification of AtPAEs is unlikely to arise from the shape of the protein. Primary structure prediction analysis of AtPAEs showed a specific motif characteristic of each clade and identified one major group of AtPAEs with a signal peptide and one group without a signal peptide. A multiple sequence alignment of the putative plant PAEs revealed consensus sequences with important putative catalytic residues: Ser, Asp, His and a pectin binding site. Data mining of gene expression profiles of AtPAE revealed that genes from clade 2 including AtPAE7, AtPAE8 and AtPAE11, which are duplicated genes, are highly expressed during plant growth and development while AtPAEs without a signal peptide, including AtPAE2 and AtPAE4, are more regulated in response to plant environmental conditions.

Conclusion: Bioinformatic analysis of plant, and particularly Arabidopsis, AtPAEs provides novel insights, including new motifs that could play a role in pectin binding and catalytic sites. The diversification of AtPAEs is likely to be related to neofunctionalization of some AtPAE genes.

Keywords: 3D homology; Arabidopsis thaliana; Conserved motifs; Pectin acetylesterase; Phylogenetic tree.


Figures

Fig. 1
Fig. 1
Phylogenetic tree of 72 plant PAE proteins. The evolutionary history was inferred by using the Maximum Likelihood method based on the JTT matrix-based model [71]. The tree with the highest log likelihood (−22,303.4018) is shown. Initial tree(s) for the heuristic search were obtained automatically by applying Neighbor-Join and BioNJ algorithms to a matrix of pairwise distances estimated using a JTT model, and then selecting the topology with superior log likelihood value. The tree is drawn to scale, with branch lengths measured in the number of substitutions per site. The analysis involved 72 amino acid sequences. All positions with less than 95% site coverage were eliminated. That is, fewer than 5% alignment gaps, missing data, and ambiguous bases were allowed at any position. There were a total of 341 positions in the final dataset. Evolutionary analyses were conducted in MEGA7 [27]. Each major clade is identified with a specific color. Clade 1 is in purple, clade 2 in green, clade 3 in blue, clade 4 in dark red and clade 5 in pink
Fig. 2
Fig. 2
Phylogenetic analysis and specific conserved sequence motifs in the Arabidopsis thaliana PAE protein sequences. a The tree shows three distinct groups of Arabidopsis PAEs. The tree was generated by neighbor-joining distance analysis of PAE protein sequences using the Muscle program in Mega 7.0 software [27]. Protein sequence alignment was achieved by BLOSUM80. The sequences used are full-length proteins without their signal peptide. b The sequence logo was made using WebLogo 3 [34]. AtPAEs are clustered in three groups according to the motif displayed by Logoplot. The position of the identified motifs is indicated
Fig. 3
Fig. 3
Model of AtPAE8 using a human Notum as template. a AtPAE8 model threaded into a human Notum (4UYU_A). b Structure of the human Notum (4UYU_A). c Structural superimposition between the modeled AtPAE8 structure (blue) and the human Notum (green). d Location of the conserved amino acid residues across the model. The conserved amino acid residues in all Arabidopsis PAEs are depicted in pink and the conserved cysteines are in olive. The putative catalytic triad is in red
Fig. 4
Fig. 4
Schematic representation of the predicted domain structure of Arabidopsis PAEs. a PAEs with signal peptide (SP). b PAEs without SP. All the Arabidopsis PAE proteins display the Pfam domain (PF 032283), characteristic of PAE protein of the CE13 family. The characteristics of these domains are summarized in Additional file 3. c Plant PAE conserved motifs. d Arabidopsis PAE consensus sequences. The conserved amino acid residues are in red and the similar residues are in black. The catalytic triad, S, D, H, is in orange. Cysteine residues are in olive
Fig. 5
Fig. 5
Structure sequence alignment of Arabidopsis PAEs with a human palmitoleoyl-protein carboxylesterase. The PAE sequence retrieved from Uniprot was structure-aligned with one human Notum (PDB code: 4UYU chain A) using Expresso [73] and rendered using ESPript3 [72]. Conserved residues are masked in red (absolutely conserved) or yellow. The catalytic triad in 4UYU is indicated by a red star. Secondary structure elements of 4UYU_A are shown at the top. α, β, n and T represent α-helix, β-strand, 310 helix and β-turn, respectively
Fig. 6
Fig. 6
PAE gene expression pattern derived from eFP Browser database during development in A. thaliana. The expression profile of all AtPAEs during plant growth and development was retrieved from the eFP Browser database [79]. Heatmap generation was performed using GraphPad Prism 7.0 software (GraphPad Software, Inc.). The color scale below the heat map indicates expression values; green indicates low gene expression while red indicates high gene expression
Fig. 7
Fig. 7
qRT-PCR analysis of the expression levels of AtPAE4, AtPAE8 and AtPAE10 during different developmental stages. Relative gene expression levels of AtPAE4 a, AtPAE8 b and AtPAE10 c in various organs from Arabidopsis grown on soil were measured using stably expressed reference genes (Clathrine and TIP41) with similar results. Only the results obtained with TIP41 are shown. Measurements were carried out in triplicate and values represent means ± SE of three biological replicates. Different letters indicate significantly different expression value at the 0.05 level with the Tukey’s test (Multiple comparisons of means). The first six stages of development are grown on MS medium plates and the others on soil
Fig. 8
Fig. 8
PAE gene expression profile derived from the eFP Browser database, in response to different types of abiotic stress in A. thaliana. The AtPAE gene expression data in response to abiotic stress from leaves a, roots b and to different pathogen infections c were retrieved from the eFP Browser database [79]. A Heatmap of these data was drawn using GraphPad Prism 7.0 software (GraphPad Software, Inc.). The color scale below the heat map indicates expression values; green indicates low gene expression while red indicates high gene expression. (P syr: Pseudomonas syringae; B cin: Botrytis cinerea; H ara: Hyaloperonospora arabidopsis and P inf: Phytophthora infestans)

Similar articles

Cited by

References

    1. Carpita NC, Gibeaut DM. Structural models of primary cell walls in flowering plants: consistency of molecular structure with the physical properties of the walls during growth. Plant J. 1993;3:1–30. doi: 10.1111/j.1365-313X.1993.tb00007.x. - DOI - PubMed
    1. Cosgrove DJ, Jarvis MC. Comparative structure and biomechanics of plant primary and secondary cell walls. Front Plant Sci. 2012;3:204. doi: 10.3389/fpls.2012.00204. - DOI - PMC - PubMed
    1. Caffall KH, Mohnen D. The structure, function, and biosynthesis of plant cell wall pectic polysaccharides. Carbohydr Res. 2009;344:1879–1900. doi: 10.1016/j.carres.2009.05.021. - DOI - PubMed
    1. Harholt J, Suttangkakul A, Scheller HV. Biosynthesis of Pectin. Plant Physiol. 2010;153:384–395. doi: 10.1104/pp.110.156588. - DOI - PMC - PubMed
    1. Gou J-Y, Miller LM, Hou G, Yu X-H, Chen X-Y, Liu C-J. Acetylesterase-Mediated Deacetylation of Pectin Impairs Cell Elongation, Pollen Germination, and Plant Reproduction. Plant Cell. 2012;24:50–65. doi: 10.1105/tpc.111.092411. - DOI - PMC - PubMed

Publication types

LinkOut - more resources