Current and cumulative malaria infections in a setting embarking on elimination: Amhara, Ethiopia
- PMID: 28595603
- PMCID: PMC5465535
- DOI: 10.1186/s12936-017-1884-y
Current and cumulative malaria infections in a setting embarking on elimination: Amhara, Ethiopia
Abstract
Background: Since 2005, Ethiopia has aggressively scaled up malaria prevention and case management. As a result, the number of malaria cases and deaths has significantly declined. In order to track progress towards the elimination of malaria in Amhara Region, coverage of malaria control tools and current malaria transmission need to be documented.
Methods: A cross-sectional household survey oversampling children under 5 years of age was conducted during the dry season in 2013. A bivalent rapid diagnostic test (RDT) detecting both Plasmodium falciparum and Plasmodium vivax and serology assays using merozoite antigens from both these species were used to assess the prevalence of malaria infections and exposure to malaria parasites in 16 woredas (districts) in Amhara Region.
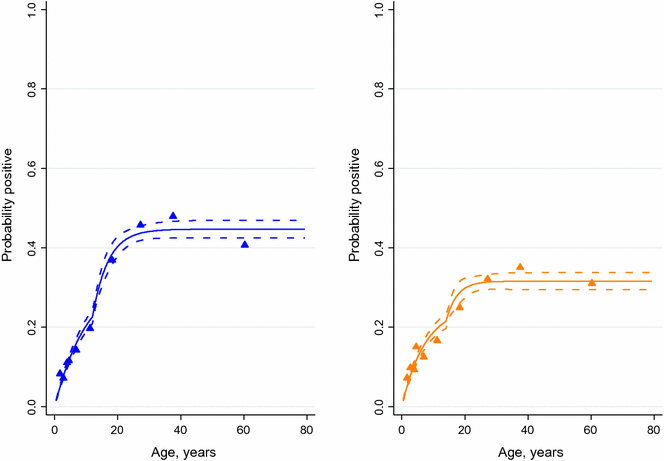
Results: 7878 participants were included, with a mean age of 16.8 years (range 0.5-102.8 years) and 42.0% being children under 5 years of age. The age-adjusted RDT-positivity for P. falciparum and P. vivax infection was 1.5 and 0.4%, respectively, of which 0.05% presented as co-infections. Overall age-adjusted seroprevalence was 30.0% for P. falciparum, 21.8% for P. vivax, and seroprevalence for any malaria species was 39.4%. The prevalence of RDT-positive infections varied by woreda, ranging from 0.0 to 8.3% and by altitude with rates of 3.2, 0.7, and 0.4% at under 2000, 2000-2500, and >2500 m, respectively. Serological analysis showed heterogeneity in transmission intensity by area and altitude and evidence for a change in the force of infection in the mid-2000s.
Conclusions: Current and historic malaria transmission across Amhara Region show substantial variation by age and altitude with some settings showing very low or near-zero transmission. Plasmodium vivax infections appear to be lower but relatively more stable across geography and altitude, while P. falciparum is the dominant infection in the higher transmission, low-altitude areas. Age-dependent seroprevalence analyses indicates a drop in transmission occurred in the mid-2000s, coinciding with malaria control scale-up efforts. As malaria parasitaemia rates get very low with elimination efforts, serological evaluation may help track progress to elimination.
Keywords: Malaria; Malaria transmission; Plasmodium falciparum; Plasmodium vivax; Seroconversion; Seroprevalence.
Figures


Similar articles
-
Microscopic and molecular evidence of the presence of asymptomatic Plasmodium falciparum and Plasmodium vivax infections in an area with low, seasonal and unstable malaria transmission in Ethiopia.BMC Infect Dis. 2015 Aug 5;15:310. doi: 10.1186/s12879-015-1070-1. BMC Infect Dis. 2015. PMID: 26242405 Free PMC article.
-
Multiplex serology demonstrate cumulative prevalence and spatial distribution of malaria in Ethiopia.Malar J. 2019 Jul 22;18(1):246. doi: 10.1186/s12936-019-2874-z. Malar J. 2019. PMID: 31331340 Free PMC article.
-
Mass testing and treatment for malaria in low transmission areas in Amhara Region, Ethiopia.Malar J. 2016 Jun 2;15:305. doi: 10.1186/s12936-016-1333-3. Malar J. 2016. PMID: 27255330 Free PMC article.
-
Malaria rapid diagnostic tests in elimination settings--can they find the last parasite?Clin Microbiol Infect. 2011 Nov;17(11):1624-31. doi: 10.1111/j.1469-0691.2011.03639.x. Epub 2011 Sep 13. Clin Microbiol Infect. 2011. PMID: 21910780 Free PMC article. Review.
-
Plasmodium spp. mixed infection leading to severe malaria: a systematic review and meta-analysis.Sci Rep. 2020 Jul 6;10(1):11068. doi: 10.1038/s41598-020-68082-3. Sci Rep. 2020. PMID: 32632180 Free PMC article.
Cited by
-
Chloroquine has shown high therapeutic efficacy against uncomplicated Plasmodium vivax malaria in southern Ethiopia: seven decades after its introduction.Malar J. 2024 Jun 10;23(1):183. doi: 10.1186/s12936-024-05009-7. Malar J. 2024. PMID: 38858696 Free PMC article.
-
Species composition, infection rate and feeding preference of Anopheles mosquito species (Diptera: Culicidae) in the west Amhara Region, northwest Ethiopia.PLoS One. 2024 Jul 25;19(7):e0307063. doi: 10.1371/journal.pone.0307063. eCollection 2024. PLoS One. 2024. PMID: 39052655 Free PMC article.
-
Malaria in Angola: recent progress, challenges and future opportunities using parasite demography studies.Malar J. 2022 Dec 28;21(1):396. doi: 10.1186/s12936-022-04424-y. Malar J. 2022. PMID: 36577996 Free PMC article. Review.
-
Spatial Distribution of Plasmodium falciparum and Plasmodium vivax in Northern Ethiopia by Microscopic, Rapid Diagnostic Test, Laboratory Antibody, and Antigen Data.J Infect Dis. 2022 Mar 2;225(5):881-890. doi: 10.1093/infdis/jiab489. J Infect Dis. 2022. PMID: 34628501 Free PMC article.
-
Malaria epidemiology and interventions in Ethiopia from 2001 to 2016.Infect Dis Poverty. 2018 Nov 5;7(1):103. doi: 10.1186/s40249-018-0487-3. Infect Dis Poverty. 2018. PMID: 30392470 Free PMC article. Review.
References
-
- President’s Malaria Initiative: Ethiopia, malaria operational plan FY 2014. http://www.pmi.gov/docs/default-source/default-document-library/malaria-.... Accessed 23 Feb 2015.
Publication types
MeSH terms
Substances
LinkOut - more resources
Full Text Sources
Other Literature Sources
Medical
Research Materials

