. 2017 Jul:21:131-141.
doi: 10.1016/j.ebiom.2017.05.030. Epub 2017 Jun 2.

A Critical Role of Zinc Importer AdcABC in Group A Streptococcus-Host Interactions During Infection and Its Implications for Vaccine Development

Affiliations

A Critical Role of Zinc Importer AdcABC in Group A Streptococcus-Host Interactions During Infection and Its Implications for Vaccine Development

Nishanth Makthal et al. EBioMedicine. 2017 Jul.

Abstract

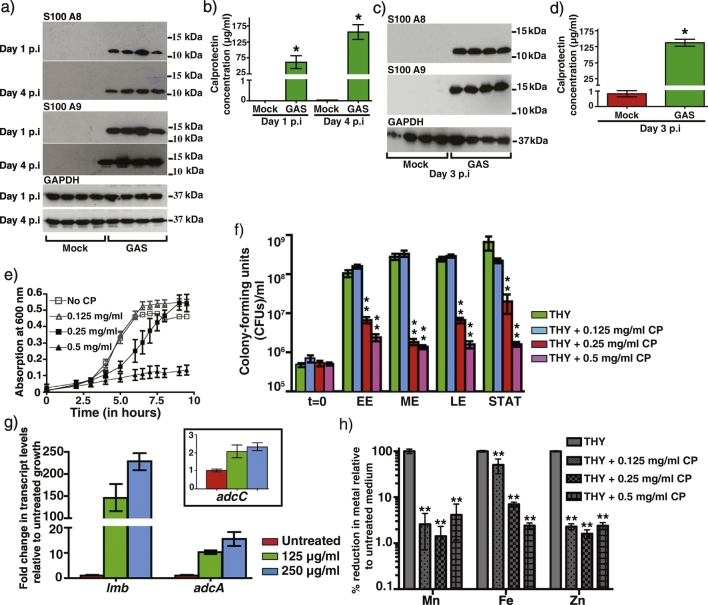
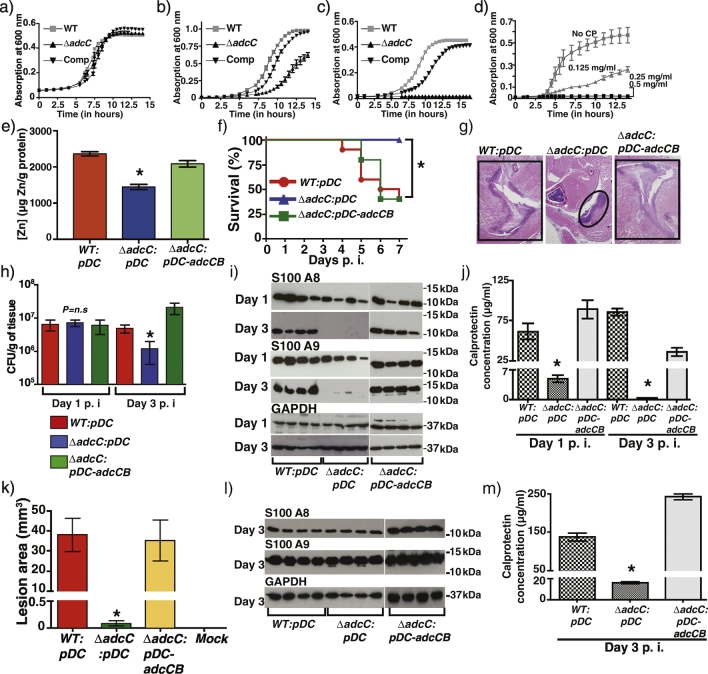
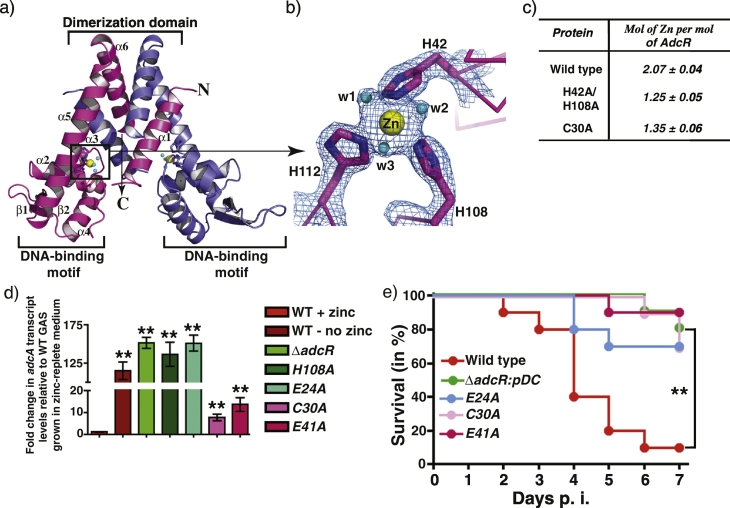
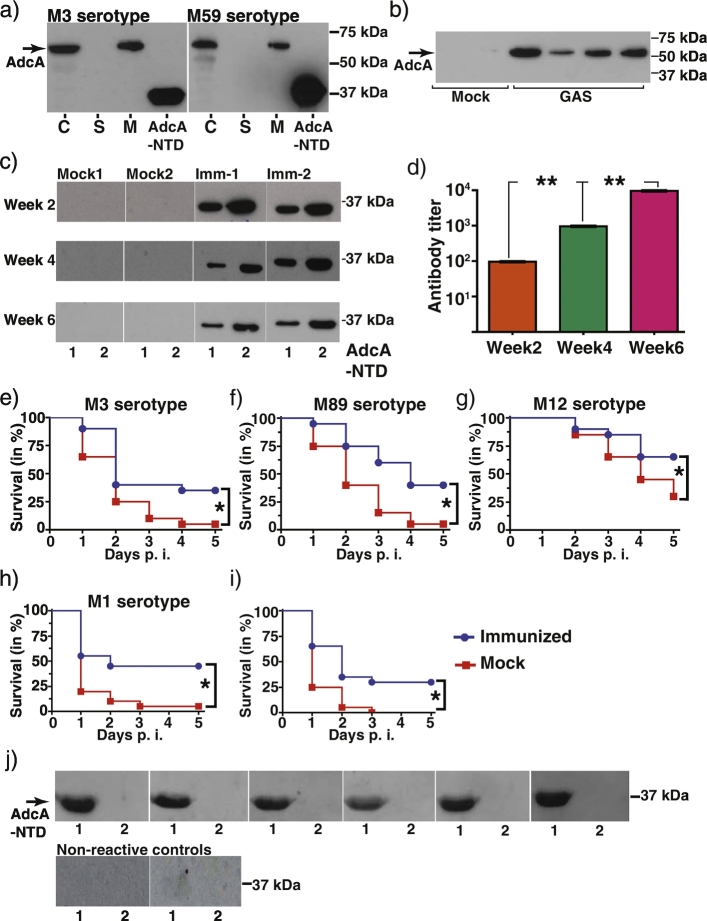
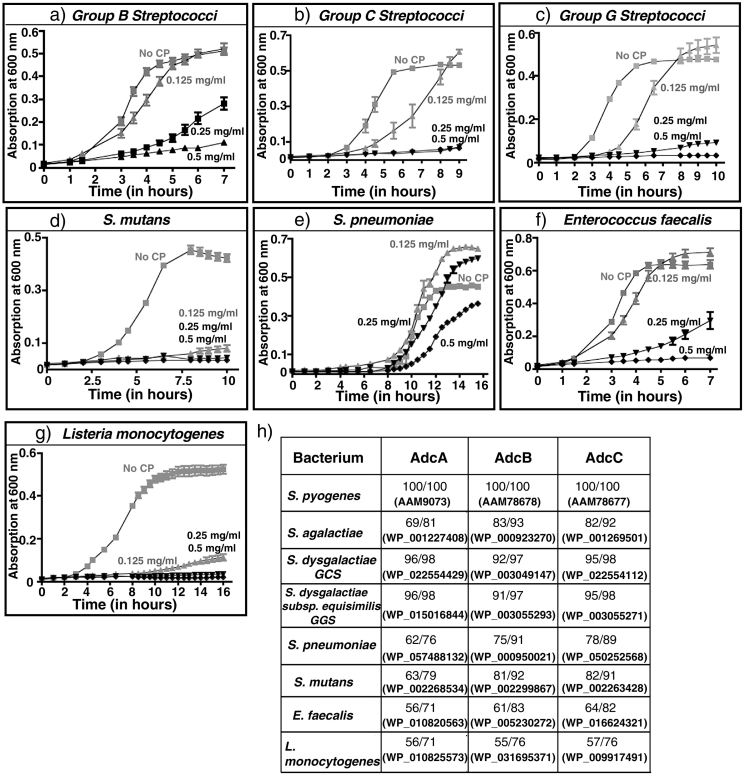
Bacterial pathogens must overcome host immune mechanisms to acquire micronutrients for successful replication and infection. Streptococcus pyogenes, also known as group A streptococcus (GAS), is a human pathogen that causes a variety of clinical manifestations, and disease prevention is hampered by lack of a human GAS vaccine. Herein, we report that the mammalian host recruits calprotectin (CP) to GAS infection sites and retards bacterial growth by zinc limitation. However, a GAS-encoded zinc importer and a nuanced zinc sensor aid bacterial defense against CP-mediated growth inhibition and contribute to GAS virulence. Immunization of mice with the extracellular component of the zinc importer confers protection against systemic GAS challenge. Together, we identified a key early stage host-GAS interaction and translated that knowledge into a novel vaccine strategy against GAS infection. Furthermore, we provided evidence that a similar struggle for zinc may occur during other streptococcal infections, which raises the possibility of a broad-spectrum prophylactic strategy against multiple streptococcal pathogens.

Keywords: GAS vaccine; Gene regulation; Group A streptococcus; Host-pathogen interactions; Nutritional immunity.


Figures

Fig. 1
Fig. 1
Calprotectin is present at the GAS colonization surface in the host. a) Lesions from mice infected intramuscularly at days 1 and 4 post-infection with either saline (mock) (n = 4) or wild type GAS (n = 4) were probed for S100A8, S100A9, and loading control GAPDH by immunoblotting. b) Quantification of calprotectin in the infected muscular tissue lesions by ELISA. Data graphed are mean ± standard deviation. Statistical significance between the mock and GAS-infected samples is indicated by * (P < 0.05). P values were derived from two-sample t-test. c) and d) Calprotectin levels in the subcutaneous abscesses of mice infected with either saline (mock) (n = 4) or wild type GAS (n = 4) were analyzed by immunoblotting (c) and quantified by ELISA (d) at day 3 post infection. Data graphed are mean ± standard deviation. Statistical significance between the mock and GAS-infected samples is indicated by * (P < 0.05). P values were derived from two-sample t-test. e) GAS were grown in triplicate in THY broth supplemented with the indicated concentrations of CP. Growth was monitored by absorption at A600 in a microplate reader at the indicated time points. f) Comparison of the number of CFUs of GAS grown in the indicated concentrations of CP. Triplicate cultures were grown at the indicated conditions. Using the optical density of the untreated GAS growth, cells were collected at the start point (t = 0), early exponential (EE, A600 – 0.125), mid-exponential (ME, A600 – 0.25), late-exponential (LE, A600 – 0.375), and stationary (STAT, A600 – 0.5). Statistical significance between the untreated and calprotectin treated samples is indicated by ** (P < 0.0001). Data graphed are mean ± standard deviation. P values were derived from two-sample t-test. g) Transcript levels of lmb, adcA, and adcC in CP-treated GAS growth compared to untreated sample measured by qRT-PCR. Three biological replicates were grown and analyzed in triplicate. Data graphed are mean ± standard deviation. h) Metal content analysis of THY broth treated with the indicated concentrations of CP. Metal concentration (M) is denoted in the y-axis (in μM). Samples were analyzed in triplicate and data graphed are mean ± standard deviation. Statistical significance between the untreated and calprotectin treated samples is indicated by ** (P < 0.0001). P values were derived from two-sample t-test.
Fig. 2
Fig. 2
Zinc limitation by calprotectin inhibits GAS growth. Growth curves of indicated strains in THY broth (a), chemically-defined medium devoid of zinc (b), and THY broth supplemented with 10 μM TPEN (c). d) The ∆ adcC mutant was grown in triplicate in nutrient rich THY broth supplemented with the indicated CP concentrations. Growth was monitored by absorption at A600 in a microplate reader at the indicated time points. e) The WT, ∆ adcC, and the trans-complemented strains were grown in THY broth and the intracellular metal content was measured by ICP-MS. Statistical significance between the WT, and ∆ adcC mutant is indicated by * (P < 0.05). Data graphed are mean ± standard deviation. P values were derived from two-sample t-test. f) Ten outbred CD-1 mice per strain were injected intramuscularly with 1 × 107 CFU of each strain. Mouse survival depicted using a Kaplan-Meier curve with P values derived by log rank test. * indicates P < 0.05. g) Histopathological analysis of hindlimb lesions from mice infected with each indicated strain. Areas of host tissue damage are boxed, whereas confined, less destructive lesions are circled. h) Twenty mice were infected intramuscularly and mean CFUs recovered from the infected muscle tissue are shown with P value as determined by t-test. * indicates P < 0.05. Data graphed are mean ± standard deviation. i) Lesions from mice infected intramuscularly with the indicated strains were probed for S100A8, S100A9, and loading control GAPDH at days 1 and 3 post-infection by immunoblotting. j) Quantification of calprotectin concentration in the infected muscular tissue lesions by ELISA. Data graphed are mean ± standard deviation. Statistical significance between the WT, and ∆ adcC mutant is indicated by * (P < 0.05). P values were derived from two-sample t-test. k) Ten immunocompetent hairless mice were infected with each indicated strain, and the lesion area produced by each strain was determined. Lesion area was measured day 3 p.i and graphed (mean ± standard error of the mean). P value was derived by log rank test. Statistical significance between the WT, and ∆ adcC mutant is indicated by * (P < 0.05). l) Calprotectin levels in the subcutaneous abscesses of mice infected with the indicated strains were analyzed by immunoblotting (l) and quantified by ELISA (m). Statistical significance of P < 0.05 between the WT and ∆ adcC mutant strain is indicated by *. Data graphed are mean ± standard deviation. P values were derived from two-sample t-test.
Fig. 3
Fig. 3
Molecular mechanism of metal sensing and gene regulation by AdcR and its contribution to GAS pathogenesis. a) Ribbon representation of the crystal structure of AdcR dimer; individual subunits of a AdcR dimer are color-coded. The zinc atom bound to each AdcR subunit are shown as spheres and colored in yellow. The water molecules that participate in zinc coordination are shown as cyan spheres. The secondary structural elements of one subunit are labeled and the amino- and carboxy-terminus of the molecule are labeled as N and C, respectively. The DNA-binding and dimerization domains of AdcR are marked and labeled. b) A close up view of the metal-binding site (boxed in panel A) with the metal binding ligands labeled. Zinc bound to the primary metal sensing site in the structure of AdcR is shown as yellow sphere and the side chains of metal coordinating amino acids are depicted in stick representation. Water molecules are shown as cyan spheres. c) Metal content analysis of AdcR by ICP-MS. Measurements are reported as average from triplicate studies. Data shown are mean ± standard deviation. d) The indicated strains were grown to late exponential phase (A600 ~ 1.0) in zinc-replete chemically defined growth medium supplemented with 15 μM ZnSO4 and transcript levels of adcA were measured by qRT-PCR. Three biological replicates were used. Data graphed are mean ± standard deviation. Average values for wild type strain grown in zinc-rich condition were used as reference and the fold changes in the transcript levels in the indicated strains relative to reference sample are shown above the bars. Statistical significance of P < 0.0001 between the reference and indicated mutant strains is indicated by **. P values were derived from two-sample t-test. e) Fifteen CD-1 mice were infected with each indicated strain intraperitoneally and the near mortality was presented on a Kaplan-Meier survival curve with P-values derived by log rank test. Statistical significance of P < 0.0001 is indicated by **.
Fig. 4
Fig. 4
AdcA is a potent vaccine candidate. a) Subcellular localization of AdcA. The cytosolic (C), secreted (S), and membrane (M) fractions of WT GAS grown to mid-exponential growth phase were isolated and probed for AdcA by western blotting. The recombinant N-terminal domain (NTD) of AdcA was used as positive control. Positions of molecular weight markers with their masses (kDa) are shown. b) AdcA is produced during infection. Protein extracts from the lesions from mice infected with either saline (mock) (n = 2) or WT GAS (GAS) (n = 4) were analyzed for AdcA by immunoblotting. c) Increasing concentrations of purified AdcA-NTD (lane 1–0.5 μg and lane 2–2 μg) were resolved by SDS-PAGE and transferred to nitrocellulose membrane. AdcA-NTD specific antibodies in serum from mice immunized intramuscularly with either 2% Aluminum hydroxide gel adjuvant (Accurate Chemical and Scientific Corporation) (mock) or AdcA-NTD mixed with 2% Aluminum hydroxide gel adjuvant (Accurate Chemical and Scientific Corporation) (Imm) at weeks 2-, 4-, and 6- post immunization were assessed by western blotting. d) Titers of AdcA-NTD specific antibodies in immunized mouse serum (n = 6 per group) measured by ELISA. Data graphed are mean ± standard deviation. Statistical significance of P < 0.0001 between the week 2 post immunization and weeks 4 and 6 post immunization samples is indicated by **. P values were derived from two-sample t-test. Immunization of mice with purified recombinant AdcA-NTD confers protection against lethal GAS infection. Kaplan-Meier survival curve of mice challenged intraperitoneally with GAS serotypes M3 (e), M89 (f), M12 (g), and M1 (h) 2 weeks after the final immunization with purified AdcA-NTD. Twenty mice per group were used for the challenge studies. Statistical significance of P < 0.05 between the mock and immunized group is indicated by *. i) Kaplan-Meier survival curve of mice challenged intraperitoneally with serotype M1 GAS 4 weeks after the final immunization with purified AdcA-NTD. Twenty mice per group were used for the challenge studies. Statistical significance denoted by P-values derived by log rank test. Statistical significance of P < 0.05 between the sham and immunized group is indicated by *. j) Immunoblot analysis of AdcA-NTD with human sera. Purified AdcA-NTD (lane 1) and cytosolic regulator RopB (lane 2) were resolved by SDS-PAGE and transferred to nitrocellulose membrane. Sera obtained from patients with invasive disease (top row) were used at 1:50,000 dilution for detection. Sera obtained from two different streptolysin O negative individuals were treated as non-reactive controls (bottom row), whereas purified cytosolic regulator RopB (lane 2) was used as a non-specific protein control.
Fig. 5
Fig. 5
Broad-spectrum anti-streptococcal activity of calprotectin. Growth characteristics of streptococcal pathogens, a) group B streptococcus (S. agalactiae), b) group C streptococcus (S. dysgalactiae), c) group G streptococcus (S. dysgalactiae subsp. equisimilis), d) S. mutans, e) S. pneumoniae, f) Enterococcus faecalis, g) Listeria monocytogenes, was assessed. Bacteria were grown in triplicate in medium supplemented with the indicated concentrations of CP. Growth was monitored by absorption at A600 in a microplate reader at the indicated time points. h) Amino acid sequence conservation of AdcA, AdcB, and AdcC proteins among different streptococcal pathogens. The respective amino acid sequence identities and chemical similarities relative to GAS sequences are shown. The protein identification number of the respective proteins is given in parentheses.

Similar articles

Cited by

References

    1. Achouiti A., Vogl T., Endeman H., Mortensen B.L., Laterre P.-F., Wittebole X., van Zoelen M.A.D., Zhang Y., Hoogerwerf J.J., Florquin S. Myeloid-related protein-8/14 facilitates bacterial growth during pneumococcal pneumonia. Thorax. 2014;69:1034–1042. - PubMed
    1. Ammendola S., Pasquali P., Pistoia C., Petrucci P., Petrarca P., Rotilio G., Battistoni A. High-affinity Zn2 + uptake system ZnuABC is required for bacterial zinc homeostasis in intracellular environments and contributes to the virulence of Salmonella enterica. Infect. Immun. 2007;75:5867–5876. - PMC - PubMed
    1. Bayle L., Chimalapati S., Schoehn G., Brown J., Vernet T. Low, and Durmort, C. Zinc uptake by Streptococcus pneumoniae depends on both AdcA and AdcAII and is essential for normal bacterial morphology and virulence. Mol. Microbiol. 2011;82:904–916. - PubMed
    1. Beres S.B., Carroll R.K., Shea P.R., Sitkiewicz I., Martinez-Gutierrez J.C., Low D.E., McGeer A., Willey B.M., Green K., Tyrrell G.J. Molecular complexity of successive bacterial epidemics deconvoluted by comparative pathogenomics. Proc. Natl. Acad. Sci. U. S. A. 2010;107:4371–4376. - PMC - PubMed
    1. Blencowe D.K., Morby A.P. Zn(II) metabolism in prokaryotes. FEMS Microbiol. Rev. 2003;27:291–311. - PubMed

MeSH terms