Clinical Trial
. 2018 Feb 1;124(2):473-481.
doi: 10.1152/japplphysiol.00299.2017. Epub 2017 Jun 8.

Extracting aerobic system dynamics during unsupervised activities of daily living using wearable sensor machine learning models

Affiliations
Clinical Trial

Extracting aerobic system dynamics during unsupervised activities of daily living using wearable sensor machine learning models

Thomas Beltrame et al. J Appl Physiol (1985). .

Abstract

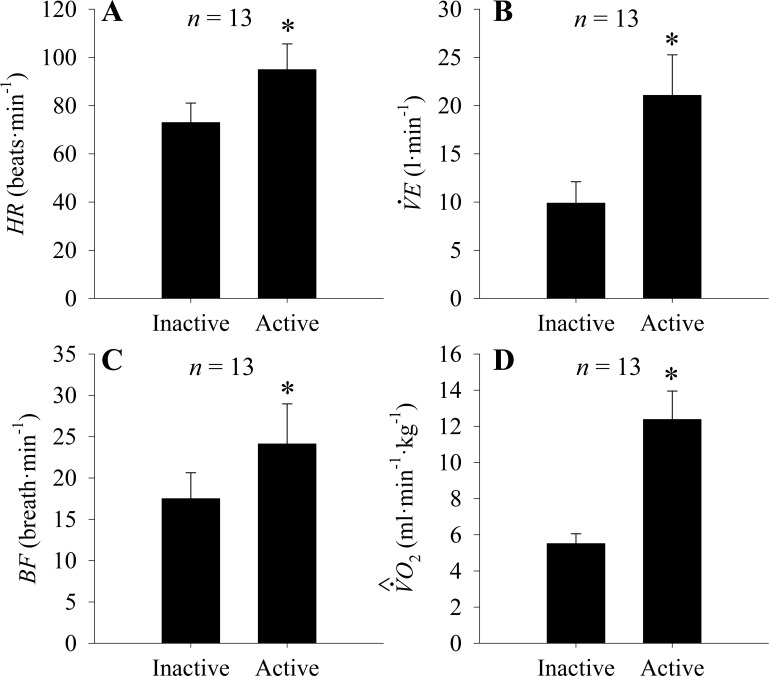
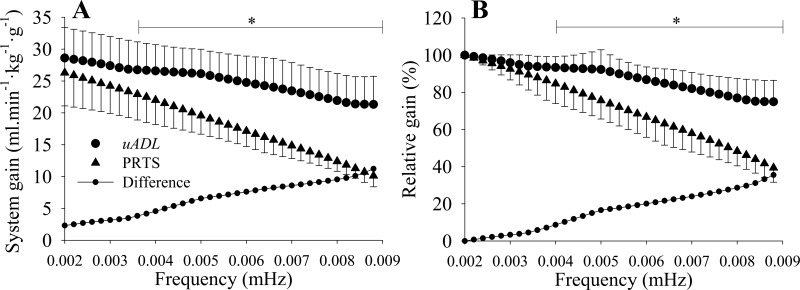
Physical activity levels are related through algorithms to the energetic demand, with no information regarding the integrity of the multiple physiological systems involved in the energetic supply. Longitudinal analysis of the oxygen uptake (V̇o2) by wearable sensors in realistic settings might permit development of a practical tool for the study of the longitudinal aerobic system dynamics (i.e., V̇o2 kinetics). This study evaluated aerobic system dynamics based on predicted V̇o2 data obtained from wearable sensors during unsupervised activities of daily living (μADL). Thirteen healthy men performed a laboratory-controlled moderate exercise protocol and were monitored for ≈6 h/day for 4 days (μADL data). Variables derived from hip accelerometer (ACCHIP), heart rate monitor, and respiratory bands during μADL were extracted and processed by a validated random forest regression model to predict V̇o2. The aerobic system analysis was based on the frequency-domain analysis of ACCHIP and predicted V̇o2 data obtained during μADL. Optimal samples for frequency domain analysis (constrained to ≤0.01 Hz) were selected when ACCHIP was higher than 0.05 g at a given frequency (i.e., participants were active). The temporal characteristics of predicted V̇o2 data during μADL correlated with the temporal characteristics of measured V̇o2 data during laboratory-controlled protocol ([Formula: see text] = 0.82, P < 0.001, n = 13). In conclusion, aerobic system dynamics can be investigated during unsupervised activities of daily living by wearable sensors. Although speculative, these algorithms have the potential to be incorporated into wearable systems for early detection of changes in health status in realistic environments by detecting changes in aerobic response dynamics. NEW & NOTEWORTHY The early detection of subclinical aerobic system impairments might be indicative of impaired physiological reserves that impact the capacity for physical activity. This study is the first to use wearable sensors in unsupervised activities of daily living in combination with novel machine learning algorithms to investigate the aerobic system dynamics with the potential to contribute to models of functional health status and guide future individualized health care in the normal population.

Keywords: aerobic fitness; kinetics; machine learning; oxygen uptake; smart devices.


Figures

Fig. 1.
Fig. 1.
Hip acceleration (ACCHIP) and measured and predicted oxygen uptake (V̇o2) response of representative participants during 2 pseudorandom ternary sequence protocols (PRTS) separated by simulated activities of daily living (ADL). The error of estimation shows a small positive bias when predicted V̇o2 for this participant was derived on the basis of the ensemble averaged predictor algorithm.
Fig. 2.
Fig. 2.
The first 5 graphs (top to bottom) show representative responses of the features obtained from wearable sensors during the 1st day of unsupervised activities of daily living. The features derived from these sensors were heart rate (HR; A), ventilation minute (V̇e; B), breathing frequency (BF; C), hip acceleration (ACCHIP; D), and walking cadence (CAD; E). The predicted oxygen uptake (V˙O2^; F) was obtained by a machine learning algorithm based on these features streamed from wearable sensors throughout the day.
Fig. 3.
Fig. 3.
Group response (means ± SD) of frequency domain amplitude (Amp) of the total hip acceleration (ACCHIP) during pseudorandom ternary sequence protocol. As a characteristic of this protocol, the stimulus energy decreases to values close to zero at even harmonics. For the correct system analysis, a range of frequencies and Amp was established (see gray area). Amp <0.05 g were considered unsatisfactory for system analysis. Frequencies >0.01 Hz were considered as nonlinear, and therefore, they were excluded from further analysis (see text).
Fig. 4.
Fig. 4.
Illustration of 1 iteration of the computer program used to optimize the oxygen uptake dynamics assessment by frequency domain analysis during unsupervised activities of daily living of a representative participant (same as displayed in Fig. 1). A: data set of the system input [i.e., hip acceleration (ACCHIP)] during the 1st day of data collection. The gray area in A has a duration defined by the window length (wl) variable and defines the data window plotted in B and C. This data selector scrolls through the entire data plotted in A (demonstrated by the arrow). B: selected time series data of ACCHIP. C: selected time series data of the system output (i.e., predicted oxygen uptake). D and E: data from B and C displayed in the frequency domain. F: system gain in frequency domain calculated by the ratio between the data displayed in D and E. ●, Satisfactory samples for frequency domain analysis in DF; ○, unsatisfactory samples. Satisfactory samples were selected according to the value of the data displayed in D, where samples with amplitude >0.05 g (dashed line) were classified as satisfactory for system analysis (see text).
Fig. 5.
Fig. 5.
A: mean group response (n = 13 for each data point) of the no. of satisfactory samples for system analysis in frequency domain (z-axis) at each tested frequency (x-axis) as a function of data window length (wl; y-axis) during 4 days of unsupervised activities of daily living. B: no. of participants who did not present a satisfactory stimulus for system analysis in at least 1 tested frequency as a function of wl.
Fig. 6.
Fig. 6.
Means ± SD of heart rate (HR; A), ventilation minute (V̇e; B), breathing frequency(BF; C), and predicted oxygen uptake (V˙O2^; D) during unsupervised activity of daily living. Data were clustered between inactive and active groups based on hip accelerometer.
Fig. 7.
Fig. 7.
Identification of physical activity patterns during 4 days of unsupervised activities of daily living. A: %time spent being active or inactive. B: when active, %time spent within each physical activity intensity domain (light, moderate, or vigorous).
Fig. 8.
Fig. 8.
A: aerobic system gains assessed as aerobic power per unit of hip acceleration (ml·min−1·kg−1·g−1) at different frequencies based on predicted oxygen uptake in the same 13 participants during unsupervised activities of daily living (μADL) and based on measured oxygen uptake during pseudorandom ternary sequence (PRTS) walking protocol. The gain during μADL was statistically higher than the gain during PRTS after 0.0036 Hz. B: aerobic system normalized gain (see text). The normalized gain during μADL was statistically higher than the gain during PRTS after 0.004 Hz. *P < 0.05.
Fig. 9.
Fig. 9.
A: linear correlation between the mean normalized gain (MNG) calculated from predicted oxygen uptake data (V˙O2^) during unsupervised activities of daily living (μADL) and calculated from measured oxygen uptake (V̇o2) data during pseudorandom ternary sequence (PRTS) walking protocol. The difference between the estimates of MNG with the 2 methods (16%) was consistent across the participants characterized by a similar linear regression slope in comparison to the equality line. B: Bland-Altman plot of the data displayed in A with the bias and the confidence interval (CI95) between the 2 methods used to estimate MNG.

Similar articles

Cited by

References

    1. Alexander NB, Dengel DR, Olson RJ, Krajewski KM. Oxygen-uptake (VO2) kinetics and functional mobility performance in impaired older adults. J Gerontol A Biol Sci Med Sci 58: M734–M739, 2003. doi:10.1093/gerona/58.8.M734. - DOI - PubMed
    1. Altini M, Penders J, Amft O. Estimating oxygen uptake during nonsteady-state activities and transitions using wearable sensors. IEEE J Biomed Health Inform 20: 469–475, 2016. doi:10.1109/JBHI.2015.2390493. - DOI - PubMed
    1. Barstow TJ, Buchthal S, Zanconato S, Cooper DM. Muscle energetics and pulmonary oxygen uptake kinetics during moderate exercise. J Appl Physiol (1985) 77: 1742–1749, 1994. - PubMed
    1. Beltrame T, Amelard R, Villar R, Shafiee MJ, Wong A, Hughson RL. Estimating oxygen uptake and energy expenditure during treadmill walking by neural network analysis of easy-to-obtain inputs. J Appl Physiol (1985) 121: 1226–1233, 2016. doi:10.1152/japplphysiol.00600.2016. - DOI - PubMed
    1. Beltrame T, Amelard R, Wong A, Hughson RL. Prediction of oxygen uptake dynamics by machine learning analysis of wearable sensors during activities of daily living. Sci Rep 7: 45738, 2017. doi:10.1038/srep45738. - DOI - PMC - PubMed

Publication types

LinkOut - more resources