

Hemoglobin concentration, total hemoglobin mass and plasma volume in patients: implications for anemia
- PMID: 28596281
- PMCID: PMC5685237
- DOI: 10.3324/haematol.2017.169680
Hemoglobin concentration, total hemoglobin mass and plasma volume in patients: implications for anemia
Abstract
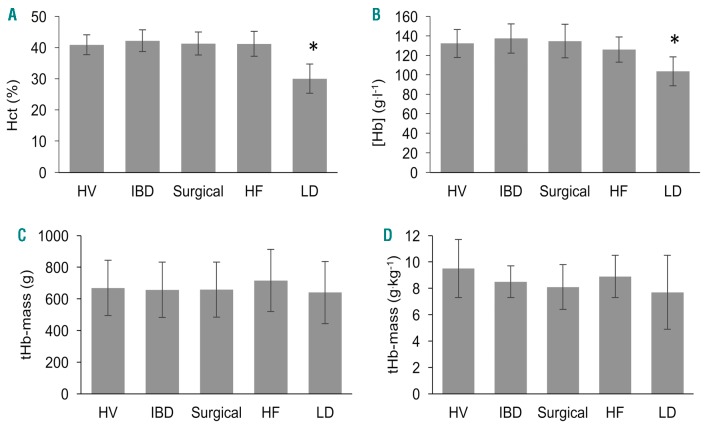
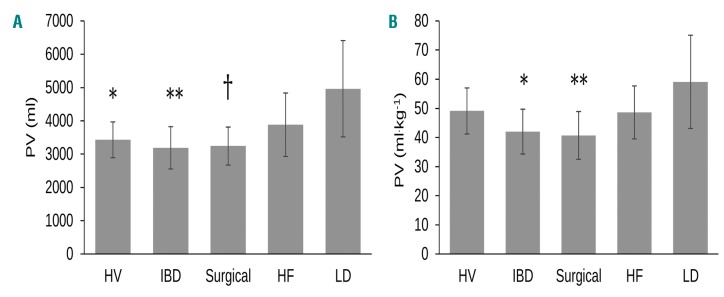
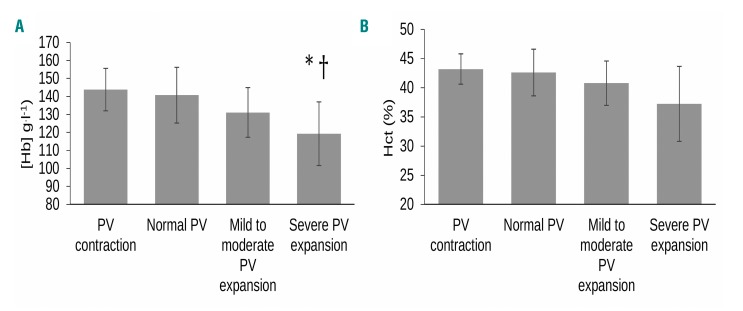
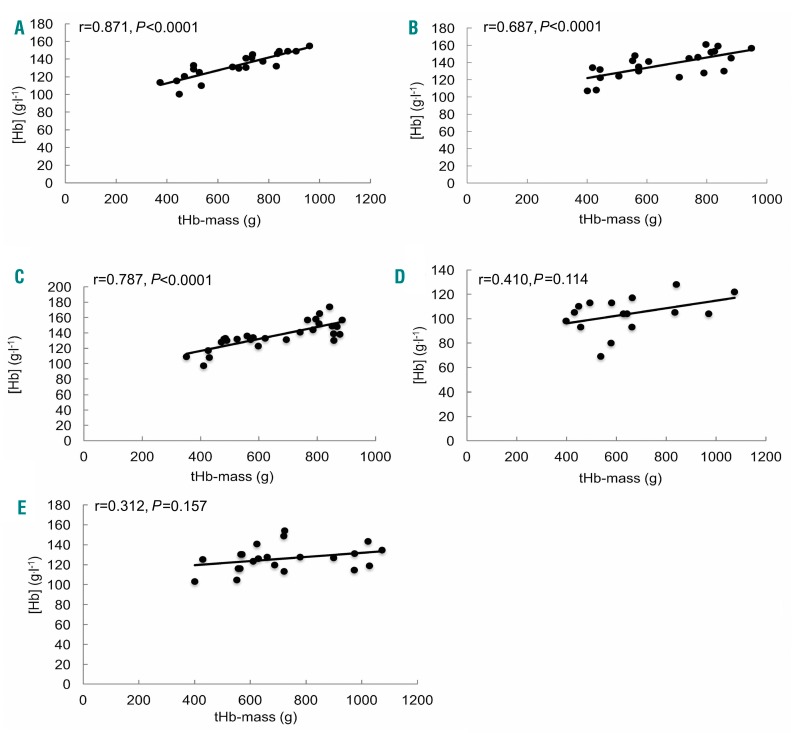
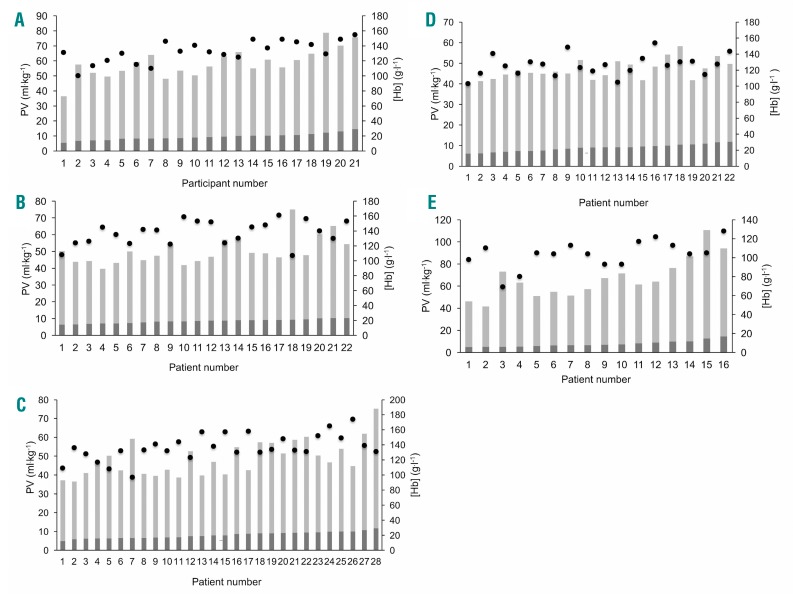
In practice, clinicians generally consider anemia (circulating hemoglobin concentration < 120 g.l-1 in non-pregnant females and < 130 g.l-1 in males) as due to impaired hemoglobin synthesis or increased erythrocyte loss or destruction. Rarely is a rise in plasma volume relative to circulating total hemoglobin mass considered as a cause. But does this matter? We explored this issue in patients, measuring hemoglobin concentration, total hemoglobin mass (optimized carbon monoxide rebreathing method) and thereby calculating plasma volume in healthy volunteers, surgical patients, and those with inflammatory bowel disease, chronic liver disease or heart failure. We studied 109 participants. Hemoglobin mass correlated well with its concentration in the healthy, surgical and inflammatory bowel disease groups (r=0.687-0.871, P<0.001). However, they were poorly related in liver disease (r=0.410, P=0.11) and heart failure patients (r=0.312, P=0.16). Here, hemoglobin mass explained little of the variance in its concentration (adjusted R2=0.109 and 0.052; P=0.11 and 0.16), whilst plasma volume did (R2 change 0.724 and 0.805 in heart and liver disease respectively, P<0.0001). Exemplar patients with identical (normal or raised) total hemoglobin masses were diagnosed as profoundly anemic (or not) depending on differences in plasma volume that had not been measured or even considered as a cause. The traditional inference that anemia generally reflects hemoglobin deficiency may be misleading, potentially resulting in inappropriate tests and therapeutic interventions to address 'hemoglobin deficiency' not 'plasma volume excess'. Measurement of total hemoglobin mass and plasma volume is now simple, cheap and safe, and its more routine use is advocated.
Copyright© 2017 Ferrata Storti Foundation.
Figures
References
-
- World Health Organisation. Haemoglobin concentration for the diagnosis of anaemia and assessment of severity 2011. http://www.who.int/vmnis/indicators/haemoglobin/en/ Accessed 28th September 2016.
-
- World Health Organization. Worldwide prevalence of anaemia 1993–2005. 2008. http://apps.who.int/iris/bitstream/10665/43894/1/9789241596657_eng.pdf Accessed 5th October 2016.
-
- Farag YM, Keithi-Reddy SR, Mittal BV, et al. Anemia, inflammation and health-related quality of life in chronic kidney disease patients. Clin Nephrol. 2011;75(6):524–533. - PubMed
-
- Chambellan A, Chailleux E, Similowski T, Group AO. Prognostic value of the hematocrit in patients with severe COPD receiving long-term oxygen therapy. Chest. 2005; 128(3):1201–1208. - PubMed
Publication types
MeSH terms
Substances
Grants and funding
LinkOut - more resources
Full Text Sources
Other Literature Sources
Medical
