. 2017 Jul 28;292(30):12483-12495.
doi: 10.1074/jbc.M117.776260. Epub 2017 Jun 8.

A new long noncoding RNA (lncRNA) is induced in cutaneous squamous cell carcinoma and down-regulates several anticancer and cell differentiation genes in mouse

Affiliations

A new long noncoding RNA (lncRNA) is induced in cutaneous squamous cell carcinoma and down-regulates several anticancer and cell differentiation genes in mouse

Gilles Ponzio et al. J Biol Chem. .

Abstract

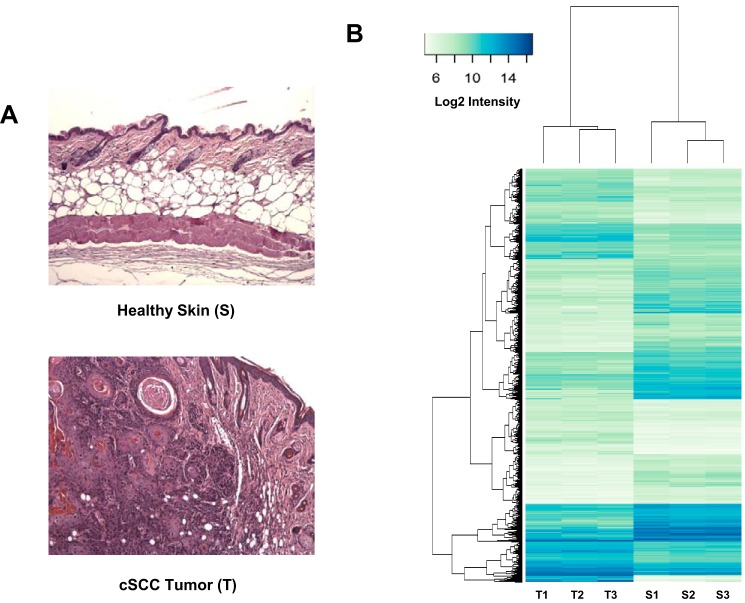
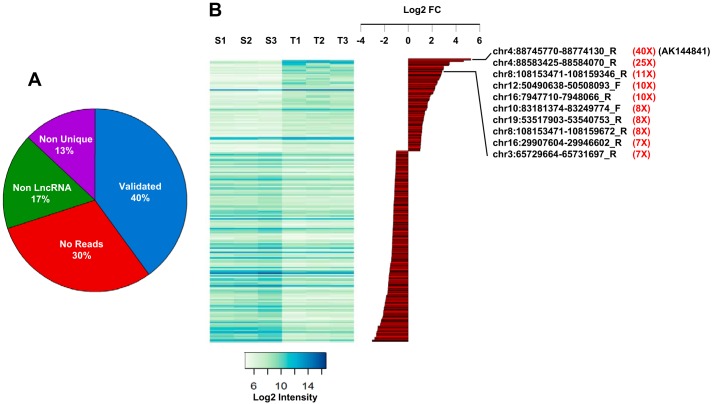
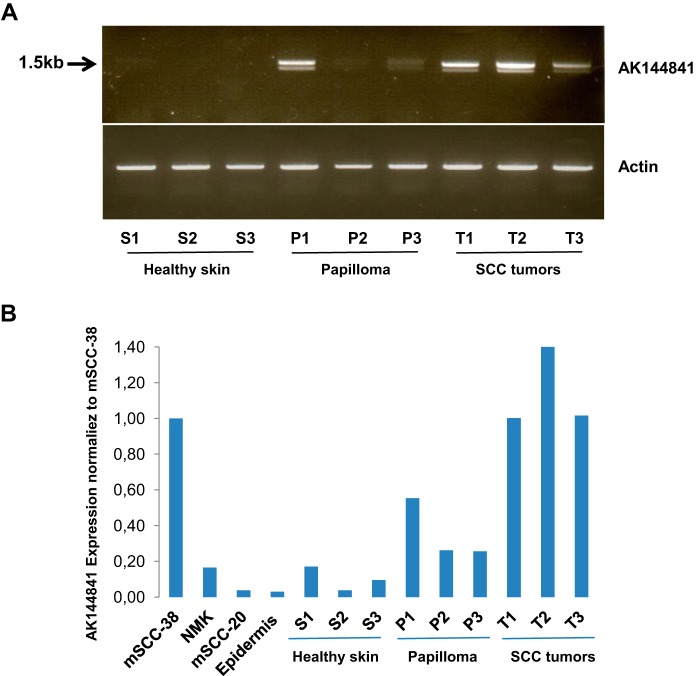
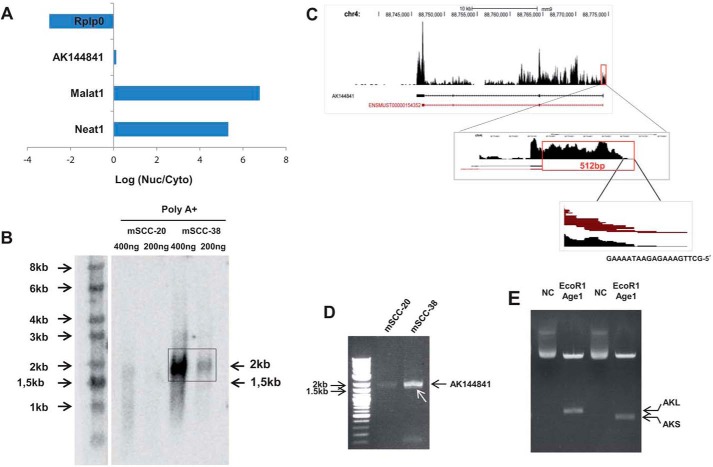
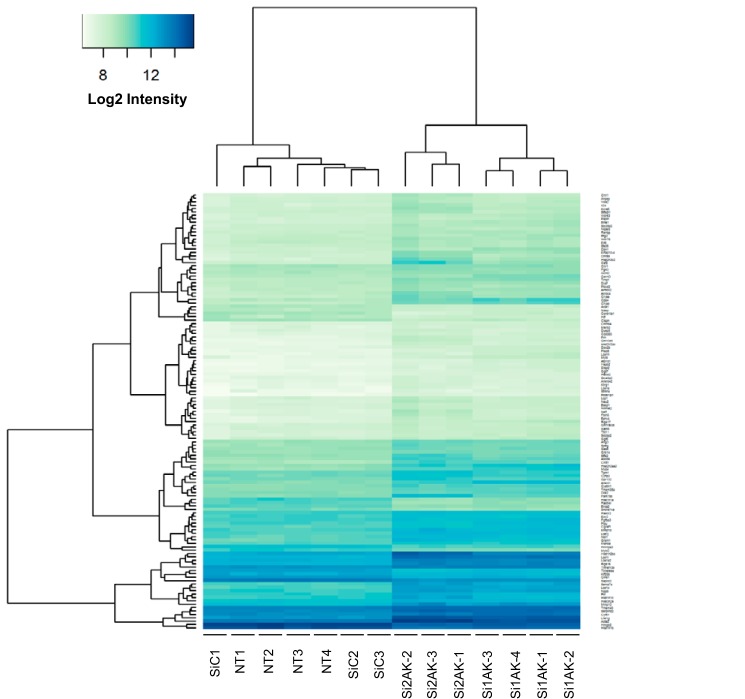
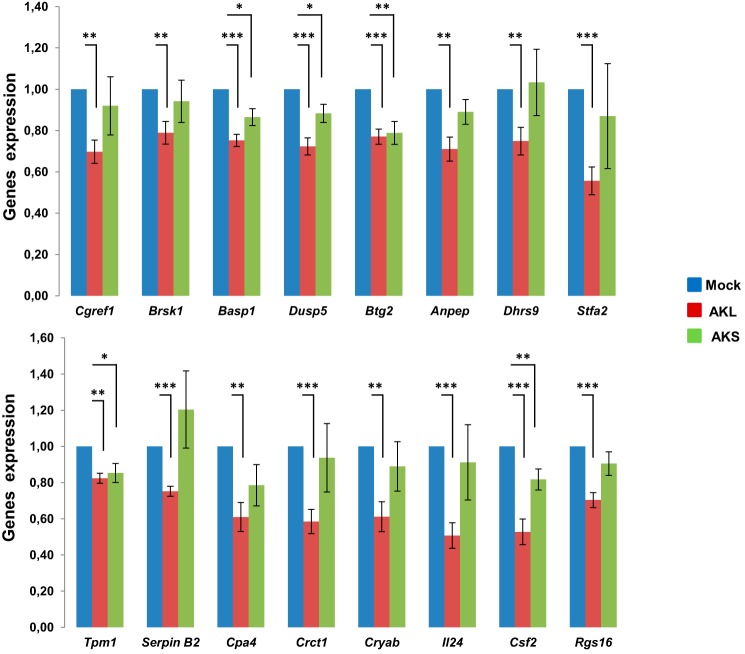
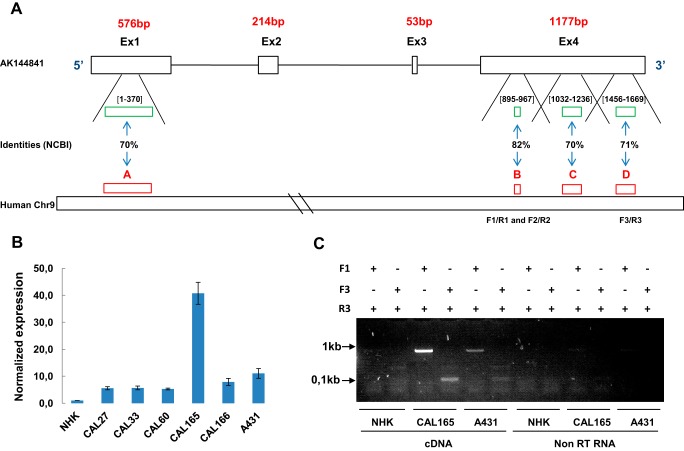
Keratinocyte-derived cutaneous squamous cell carcinoma (cSCC) is the most common metastatic skin cancer. Although some of the early events involved in this pathology have been identified, the subsequent steps leading to tumor development are poorly defined. We demonstrate here that the development of mouse tumors induced by the concomitant application of a carcinogen and a tumor promoter (7,12-dimethylbenz[a]anthracene (DMBA) and 12-O-tetradecanoylphorbol-13-acetate (TPA), respectively) is associated with the up-regulation of a previously uncharacterized long noncoding RNA (lncRNA), termed AK144841. We found that AK144841 expression was absent from normal skin and was specifically stimulated in tumors and highly tumorigenic cells. We also found that AK144841 exists in two variants, one consisting of a large 2-kb transcript composed of four exons and one consisting of a 1.8-kb transcript lacking the second exon. Gain- and loss-of-function studies indicated that AK144841 mainly inhibited gene expression, specifically down-regulating the expression of genes of the late cornified envelope-1 (Lce1) family involved in epidermal terminal differentiation and of anticancer genes such as Cgref1, Brsk1, Basp1, Dusp5, Btg2, Anpep, Dhrs9, Stfa2, Tpm1, SerpinB2, Cpa4, Crct1, Cryab, Il24, Csf2, and Rgs16 Interestingly, the lack of the second exon significantly decreased AK144841's inhibitory effect on gene expression. We also noted that high AK144841 expression correlated with a low expression of the aforementioned genes and with the tumorigenic potential of cell lines. These findings suggest that AK144841 could contribute to the dedifferentiation program of tumor-forming keratinocytes and to molecular cascades leading to tumor development.

Keywords: RNA; cancer biology; long noncoding RNA (long ncRNA, lncRNA); microarray; skin.


Conflict of interest statement

The authors declare that they have no conflicts of interest with the contents of this article

Figures

Figure 1.
Figure 1.
Gene expression analysis of biopsies of healthy skin and cSCC tumor samples. A, example of tissue sections of healthy mouse skin (S) and DMBA/TPA-induced cSCC tumors (T) used for the transcriptomic analysis. Pictures correspond to hematoxylin/eosin-counterstained formalin-fixed paraffin-embedded sections. B, RNAs extracted from three individual samples of healthy skin treated with acetone only (S1–S3) and three DMBA/TPA-generated cSCC tumors (T1–T3) (see A) were labeled with Cy3 and hybridized with mouse gene expression 8 × 60,000 v1 microarrays from Agilent as described under “Experimental procedures.” The graph shows the heat map comparing the normalized log2 of gene intensity signal in the different conditions. The following threshold values were used to define the set of up- and down-regulated genes: average expression >7.0, absolute log FC >1.0, adjusted p value <0.05.
Figure 2.
Figure 2.
lncRNA expression in healthy skin (S1–S3) and in DMBA/TPA-generated cSCC tumors (T1–T3). A, pie chart summarizing the validation analysis of the lncRNA probes spotted on the Agilent SurePrint microarray (see “Results”). Among the 507 probes up- and down-regulated between healthy skin and tumors, only 202 (40%) have been validated. When considering the 305 transcripts that were excluded, 30% (211) were indeed not detected by RNAseq at a cutoff above four reads, 17.4% (53) showed complementarity with multiple chromosomal regions, and 13.4% (41) were located in exons of protein-coding genes. B, heat map (left) representing the expression intensity of the 202 validated probes in the three samples of normal skin (S1–S3) and tumors (T1–T3). Histograms represent the log2(T/S ratio) (log2 FC) of the validated probes, highlighting the top 10 lncRNAs significantly up-regulated in tumors and the amplitude of their overexpression in tumors (in red). Note that AK144841 is the most up-regulated gene.
Figure 3.
Figure 3.
PCR identification of AK144841 in biological samples. A, RNA was extracted from three individual samples of normal skin (S1–S3) and tumors (T1–T3) and reverse transcribed, and AK144841 was then amplified by classical PCR using specific primer sets located in exons 1 and 4 (upper panel) designed according to the sequence of AK144841 reported in public data. The lower panel represents the amplification of actin used as a control. B, quantification of AK144841 by qPCR in cultured cells (mSCC-38 and mSCC-20), in NMKs, and in samples of normal skin (epidermis; S1–S3), papillomas (P1–P3), and SCC tumors (T1–T3). The histograms represent the expression of AK144841 in the different samples normalized according to its level in mSCC-38. The represented experiment is a typical one chosen among three.
Figure 4.
Figure 4.
Left, cytolocalization of AK144841 and Northern blot analysis. A, cellular localization of AK144841. The cytoplasmic (Cyto) and nuclear (Nuc) fractions of mSCC-38 cells were separated using PARISTM. RNA was extracted, and the expression of the indicated genes was measured by qPCR. The figure represents the ratio of the expression of each gene between the cytosol and the nucleus. Neat1 and Malat1 are specific markers of the nuclear fraction, whereas Rplp0 is exclusively cytoplasmic. B, AK144841 expression in mSCC-38 and mSCC-20 cells determined by Northern blotting. Northern blotting was performed using 400 or 200 ng of poly(A)+ RNAs purified using oligo(dT)-coupled magnetic beads and hybridized with a radiolabeled probe specific for AK144841. The arrows indicate the size of AK144841 (2 kb) detected in mSCC-38 cells and the position of the expected AK144841 according to the sequence available in public data set (1.5 kb). Right, structural characterization of AK144841. C, characterization of the 5′-extremity of AK144841 by RNAseq. Upper panel, RNAseq read coverage of the AK144841 region on chromosome 4 (chr4). Middle panel, coverage graph of the 5′-end of AK144841showing a magnification of the new extremity of the first exon. The red box is drawn around the 512-bp region that maps beyond the initially reported 5′-extremity of AK144841. The bottom panel shows the 20-bp sequence corresponding to the 5′-extremity of AK144841 determined from the analysis of our RNAseq data set. The mouse genome reference was NCBI37/mm9. D, PCR amplification of AK144841 from cDNA of mSCC-38 and mSCC-20 using primer sets corresponding to the 5′- and 3′-ends determined by RNAseq as illustrated in A. Note the presence of the two adjacent fragments with the more intense band corresponding to AKL (∼2 kb), whereas the weaker band corresponds to AKS (white arrow). Note the weak expression of AK144841 in mSCC-20. E, cloning of AKL and AKS. PCR-amplified AKS + AKL were subcloned into pLJM1 as described under “Experimental procedures,” and then each isoform was identified after cleavage of the purified plasmids with both AgeI and EcoRI. Lane NC represents the migration of the non-cleaved plasmid.
Figure 5.
Figure 5.
Effects of AK144841 silencing on the mSCC-38 cell transcriptome. mSCC-38 cells were transfected with two distinct siRNAs directed against AK144841 (Si1AK and Si2AK) and a control siRNA (SiC). The gene expression profiles were determined at 48 h post-transfection using a pan genomic microarrays (gene expression 8 × 60,000 microarrays from Agilent). The graph shows the heat map representing the normalized log2 intensity of the 129 genes whose expression is statistically modulated by AK144841 siRNA in the different experimental conditions. Threshold values used to select the 129 up- and down-regulated genes represented on the heat map are average expression >7.0, absolute log FC >0.6, and adjusted p value <0.05. NT1–4, four samples of non-transfected mSCC-38 cells. SiC1–3, three samples of mSCC-38 cells transfected with a non-relevant siRNA (SiC). Si1AK1–4, four samples of mSCC-38 cells transfected with Si1AK, the first AK144841-specific siRNA. Si2AK1–3, three samples of mSCC-38 cells transfected with Si2AK, the second AK144841 siRNA.
Figure 6.
Figure 6.
Effect of AK144841 overexpression on genes whose expression was up-regulated upon AK144841 silencing. mSCC-38 cells were transfected with plasmids pLJM1-AKL and -AKS or an empty pLJM1 using Lipofectamine 3000 and harvested after 72 h. Total RNA was extracted, and the expression of Cgref1, Brsk1, Basp1, Dusp5, Btg2, Anpep, Dhrs9, Stfa2, Tpm1, SerpinB2, Cpa4, Crct1, Cryab, Il24, Csf2, and Rgs16 mRNA was measured by qPCR using specific primers. The histograms represent the expression of each gene normalized to their expression in cells transfected with the empty pLJM1 (Mock). Error bars represent the S.E. of five individual experiments, and asterisks represent the Student's t test p value (*, p < 0.05; **, p < 0.01; ***, p < 0.001). The transfection efficiency estimated using a pLJM1-GFP vector was ∼30%. The primer sequences can be obtained by request.
Figure 7.
Figure 7.
Identification of hAK144841. A, representation of the four regions on human chromosome 9 (A, B, C, and D) showing identities >70% with mouse AK144841. A, Chr9:21788348–21788715; B, Chr9:21754756–21754828; C, Chr9:21754518–21754740; D, Chr9:21753686–21753902. The green boxes and the numbers between brackets schematize the position of these identities on Exon 1 and Exon 4 of AK144841. B, research and quantification of a putative hAK144841 transcript in different SCC cell lines by qPCR. Experiments were performed using oligo(dT)-synthesized cDNA of the indicated cells lines and the three different primer sets (F1/R1, F2/R2, and F3/R3) designed in the regions presenting homologies with AK144841 as indicated on the scheme in A. The expression of AK144841 was normalized to its level in NHKs. The graph represents the mean of two different experiments. Error bars represent S.E. of three experiments. C, classical PCR experiments performed using cDNA and non-reverse-transcribed RNAs of CAL165 and A431 cells. Two primers sets, F1/R3 and F3/R3, were used, generating amplicons of about 800 and 100 bp, respectively. Note the absence of amplification when the PCRs were carried out with non-reverse-transcribed (non-RT) RNAs.

Similar articles

Cited by

References

    1. Madan V., Lear J. T., and Szeimies R. (2010) Non-melanoma skin cancer. Lancet 375, 673–685 - PubMed
    1. Durinck S., Ho C., Wang N. J., Liao W., Jakkula L. R., Collisson E. A., Pons J., Chan S.-W., Lam E. T., Chu C., Park K., Hong S. W., Hur J. S., Huh N., Neuhaus I. M., et al. (2011) Temporal dissection of tumorigenesis in primary cancers. Cancer Discov. 1, 137–143 - PMC - PubMed
    1. Emmert S., Schön M. P., and Haenssle H. A. (2014) Molecular biology of basal and squamous cell carcinomas. Adv. Exp. Med. Biol. 810, 234–252 - PubMed
    1. Ratushny V., Gober M. D., Hick R., Ridky T. W., and Seykora J. T. (2012) From keratinocyte to cancer: the pathogenesis and modeling of cutaneous squamous cell carcinoma. J. Clin. Investig. 122, 464–472 - PMC - PubMed
    1. Rentoft M., Fahlén J., Coates P. J., Laurell G., Sjöström B., Rydén P., and Nylander K. (2011) miRNA analysis of formalin-fixed squamous cell carcinomas of the tongue is affected by age of the samples. Int. J. Oncol. 38, 61–69 - PubMed

Publication types

Substances