. 2017 Jul 18;8(29):46781-46800.
doi: 10.18632/oncotarget.18108.

Mislocalization of centromeric histone H3 variant CENP-A contributes to chromosomal instability (CIN) in human cells

Affiliations

Mislocalization of centromeric histone H3 variant CENP-A contributes to chromosomal instability (CIN) in human cells

Roshan L Shrestha et al. Oncotarget. .

Abstract

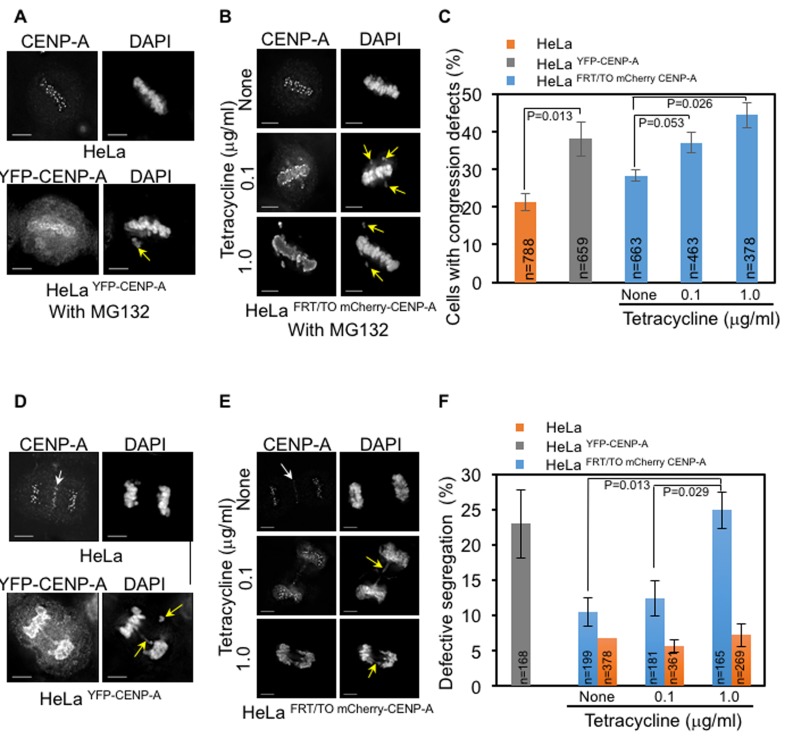
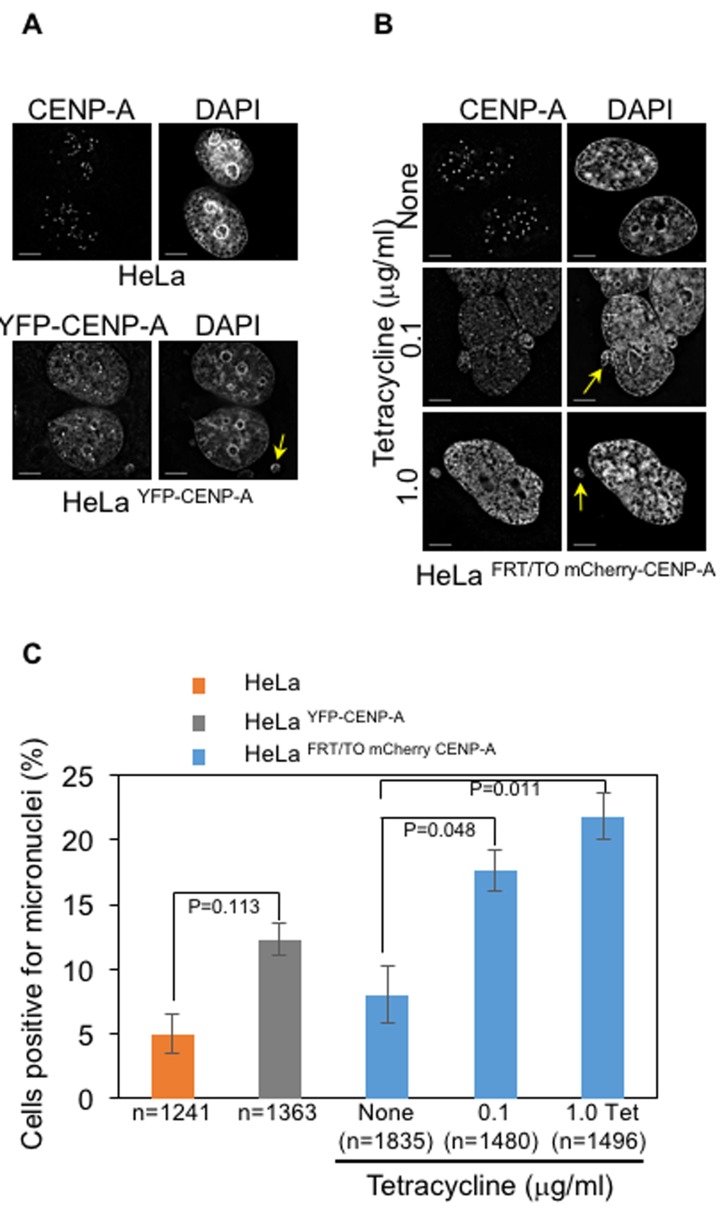
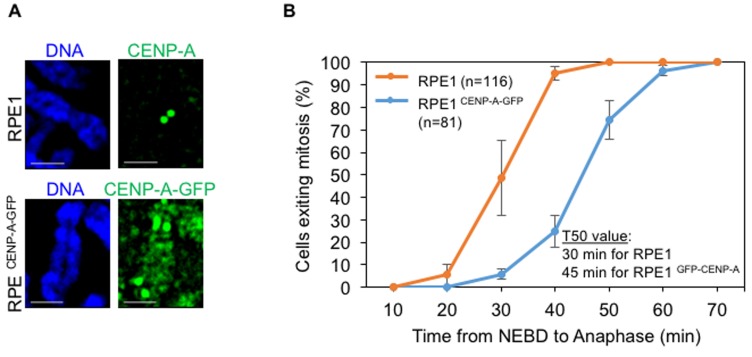
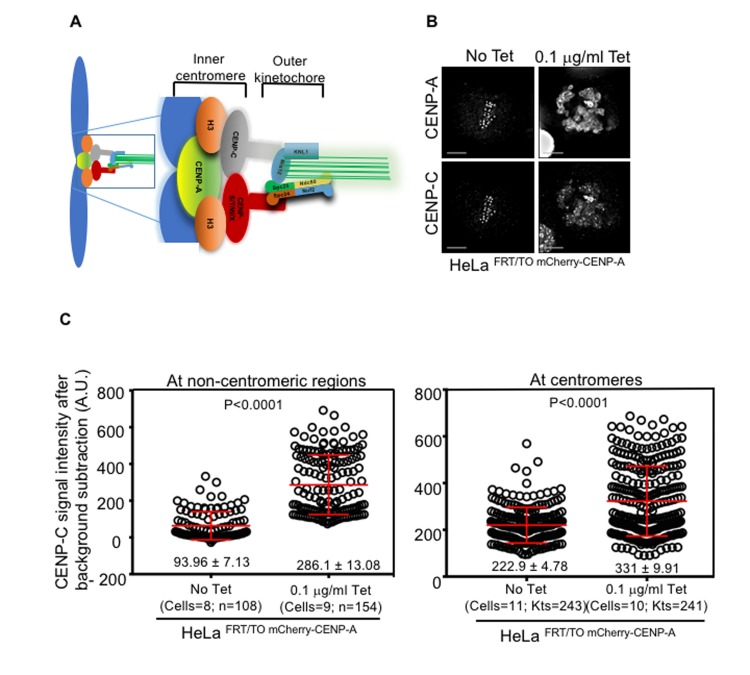
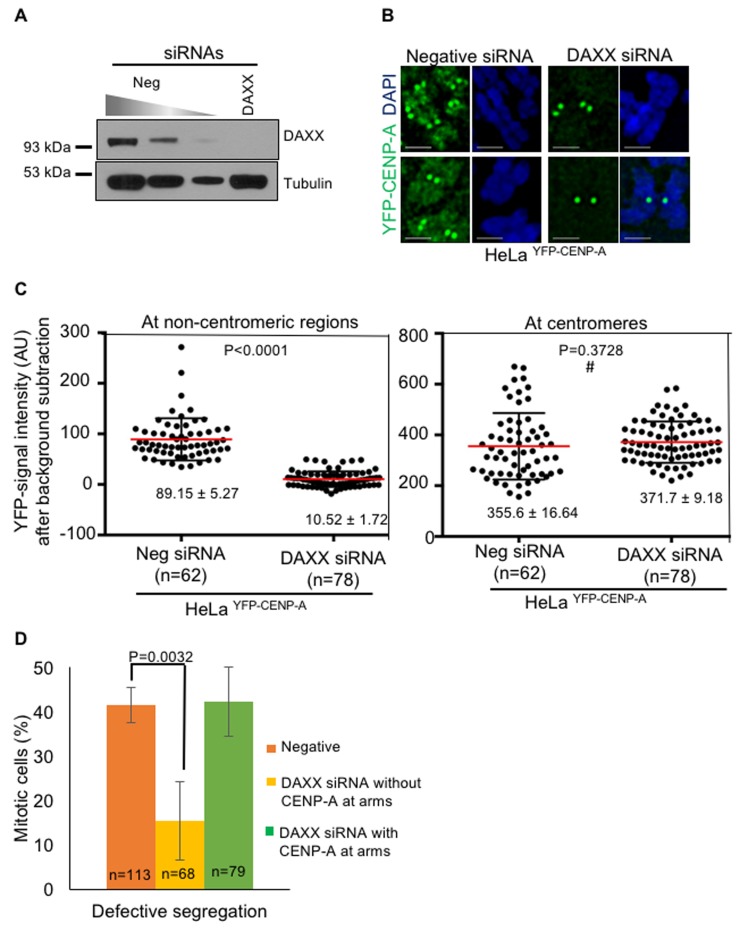
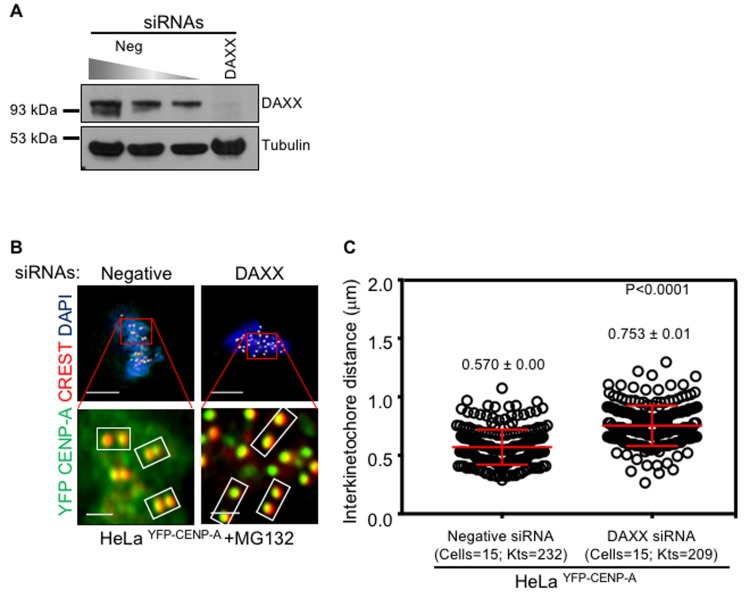
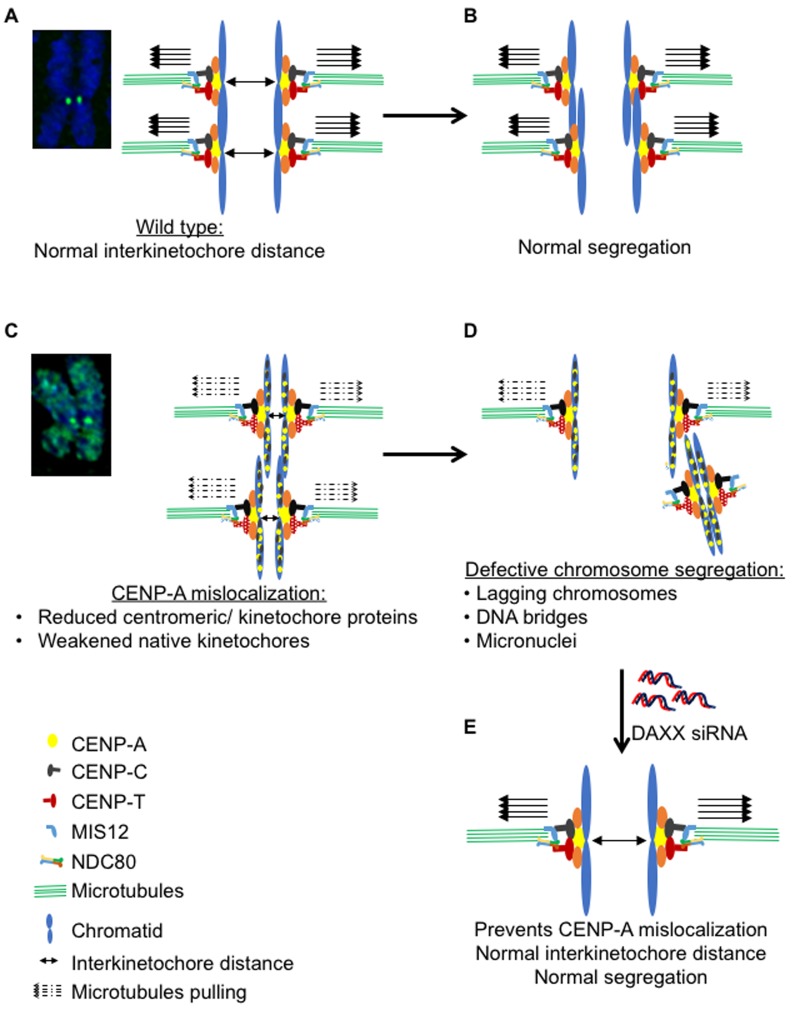
Chromosomal instability (CIN) is a hallmark of many cancers and a major contributor to tumorigenesis. Centromere and kinetochore associated proteins such as the evolutionarily conserved centromeric histone H3 variant CENP-A, associate with centromeric DNA for centromere function and chromosomal stability. Stringent regulation of cellular CENP-A levels prevents its mislocalization in yeast and flies to maintain genome stability. CENP-A overexpression and mislocalization are observed in several cancers and reported to be associated with increased invasiveness and poor prognosis. We examined whether there is a direct relationship between mislocalization of overexpressed CENP-A and CIN using HeLa and chromosomally stable diploid RPE1 cell lines as model systems. Our results show that mislocalization of overexpressed CENP-A to chromosome arms leads to chromosome congression defects, lagging chromosomes, micronuclei formation and a delay in mitotic exit. CENP-A overexpressing cells showed altered localization of centromere and kinetochore associated proteins such as CENP-C, CENP-T and Nuf2 leading to weakened native kinetochores as shown by reduced interkinetochore distance and CIN. Importantly, our results show that mislocalization of CENP-A to chromosome arms is one of the major contributors for CIN as depletion of histone chaperone DAXX prevents CENP-A mislocalization and rescues the reduced interkinetochore distance and CIN phenotype in CENP-A overexpressing cells. In summary, our results establish that CENP-A overexpression and mislocalization result in a CIN phenotype in human cells. This study provides insights into how overexpression of CENP-A may contribute to CIN in cancers and underscore the importance of understanding the pathways that prevent CENP-A mislocalization for genome stability.

Keywords: CENP-A; Chromosome Section; DAXX; cancer; centromeres; chromosomal instability.


Conflict of interest statement

CONFLICTS OF INTEREST

No potential conflict of interest

Figures

Figure 1
Figure 1. Overexpressed CENP-A mislocalizes to chromosome arms in human cells
A. Constitutive overexpression of CENP-A leads to mislocalization to chromosome arms. Representative chromosome spread images of HeLa YFP-CENP-A cells immunostained with antibody against GFP to visualize YFP-CENP-A and stained with DAPI for DNA. Insets correspond to boxed area in the main image. Scale bar: for insets. B. Inducible expression of CENP-A leads to mislocalization to chromosome arms. Representative chromosome spread images of HeLa FRT/TO mCherry-CENP-A cells treated with indicated concentrations of tetracycline. Cells were immunostained with antibody against CENP-A and stained with DAPI for DNA. Scale bar: 2 μm. C. CENP-A levels increased at non-centromeric regions but not at centromeres in CENP-A overexpressing cells. Prism graphs show signal intensities of CENP-A at centromeres (left) and non-centromeric regions (right) in chromosome spreads of HeLa FRT/TO mCherry-CENP-A cells treated with indicated concentrations of tetracycline. Each circle represents a spot and ‘n’ denotes number of spots analyzed. Red horizontal lines represent mean signal intensity as indicated. Error bars represent standard error of mean (SEM) across areas measured. P-values calculated using the Mann-Whitney U test are indicated.
Figure 2
Figure 2. CENP-A overexpression contributes to chromosome congression and segregation defects in human cells
A.-B. Constitutive and inducible expression of CENP-A contribute to chromosome congression defects. Immunofluorescence images of HeLa and Hela YFP-CENP-A (A) and HeLa FRT/TO mCherry-CENP-A (B) cells show chromosome congression status. HeLa FRT/TO mCherry-CENP-A cells were treated with different concentrations of tetracycline. Prior to immunostaining, all cells were treated with 10 μM MG132 for three hours. Cells were immunostained with antibodies against CENP-A for HeLa and HeLa FRT/TO mCherry-CENP-A and GFP for Hela YFP-CENP-A to visualize CENP-A. Cells were also stained with DAPI for DNA. Immunostained cells were imaged and analyzed for chromosome congression status. Yellow arrows show uncongressed chromosomes. Scale bar is 5 μm. C. Proportion of cell with defective chromosome congression is higher in CENP-A overexpressing cells. Bar chart shows the proportion of HeLa, HeLa YFP-CENP-A and HeLa FRT/TO mCherry-CENP-A cells with defective chromosome congression. Error bar represents standard error of mean (SEM) across five (for HeLa and HeLa YFP CENP-A) or three (for HeLa FRT/TO mCherry CENP-A) independent experiments. ‘n’ denotes number of cells analyzed. D.-E. Constitutive and inducible expression of CENP-A contribute to chromosome segregation defects. Immunofluorescence images of HeLa and Hela YFP-CENP-A (D) and HeLa FRT/TO mCherry-CENP-A (E) cells show chromosome segregation status. HeLa FRT/TO mCherry-CENP-A cells were treated with different concentrations of tetracycline. Cells were immunostained with antibodies against CENP-A for HeLa and HeLa FRT/TO mCherry-CENP-A and GFP for Hela YFP-CENP-A to visualize CENP-A. Cells were also stained with DAPI for DNA. Immunostained cells were imaged and analyzed for mitotic outcomes. White arrows show non-specific staining of CENP-A at the midzone and yellow arrows show missegregated chromosomes and DNA bridges. Scale bar: 5 μm. F. Proportion of cells with defective chromosome segregation is higher in CENP-A overexpressing cells. Bar chart shows the proportion of HeLa YFP-CENP-A, HeLa FRT/TO mCherry-CENP-A and HeLa cells with defective segregation of chromosomes. HeLa and HeLa FRT/TO mCherry-CENP-A cells were treated with indicated concentrations of tetracycline. Error bars represent standard error of mean (SEM) from three independent experiments. ‘n’ denotes number of cells analyzed. P-values calculated using the proportion test are indicated.
Figure 3
Figure 3. CENP-A overexpression contributes to increased incidence of micronuclei in human cells
A.-B. Constitutive and inducible expression of CENP-A contribute to increased incidence of micronuclei. Immunofluorescence images of HeLa and Hela YFP-CENP-A (A) and HeLa FRT/TO mCherry-CENP-A (B) show presence of micronuclei in interphase cells. Prior to immunostaining, HeLa FRT/TO mCherry-CENP-A cells were treated with different concentrations of tetracycline. Cells were immunostained with antibodies against CENP-A for HeLa and HeLa FRT/TO mCherry-CENP-A and GFP for Hela YFP-CENP-A to visualize CENP-A. Cells were also stained with DAPI for DNA. Immunostained cells were imaged and analyzed for presence of micronuclei. Yellow arrows show micronuclei in HeLa YFP CENP-A and HeLa FRT/TO mCherry-CENP-A cells treated with different concentrations of tetracycline. Scale bar: 5 μm. C. Proportion of cells positive for micronuclei is higher in CENP-A overexpressing cells. Bar chart shows the proportion of HeLa, HeLa YFP-CENP-A and HeLa FRT/TO mCherry-CENP-A with micronuclei. Error bars represent standard error of mean (SEM) from three (for HeLa and HeLa YFP CENP-A) or six (for HeLa FRT/TO mCherry CENP-A) independent experiments. ‘n’ denotes number of cells analyzed. P-values calculated using the proportion test are indicated
Figure 4
Figure 4. CENP-A overexpression induces mislocalization in non-transformed diploid RPE1 cell line
A. Overexpressed CENP-A mislocalizes to chromosome arms in RPE1 cells. Representative images of chromosomes of RPE1 and RPE1 CENP-A-GFP cells show localization of CENP-A. Chromosome spreads were prepared and immunostained with antibodies against CENP-A for RPE1 and GFP for RPE1 CENP-A-GFP to visualize CENP-A and stained with DAPI for DNA. Scale bar: 1 μm. B. CENP-A overexpressing RPE1 cells show a delay in mitotic exit. Cumulative distribution graph of mitotic exit time (from Nuclear envelop breakdown to anaphase) in RPE1 and RPE1 CENP-A-GFP cells accrued from time-lapse movies. GFP and DIC channels for RPE CENP-A GFP cells and DIC alone for RPE1 cells were used to ascertain the nuclear envelope breakdown (NEBD) and anaphase onset. T50 represents the time point at which at least 50% of cells exited mitosis. ‘n’ denotes number of cells analyzed. Error bars represent standard error of mean from four independent experiments.
Figure 5
Figure 5. CENP-C mislocalizes to non-centromeric regions in CENP-A overexpressing cells
A. Schematic diagram showing subsets of outer and inner kinetochore proteins. B. CENP-C mislocalizes to non-centromeric regions in CENP-A overexpressing cells. Representative immunofluorescence images of HeLa FRT/TO mCherry-CENP-A cells untreated or treated with 0.1 μg/ml tetracycline show mislocalization of CENP-C along with overexpressed CENP-A. Cells were immunostained with antibodies against CENP-C, CENP-A, and CREST antisera for centromeres. Scale bar is 5 μm. C. CENP-C levels increase at centromeres and non-centromeric regions in CENP-A overexpressing cells. Prism graphs show CENP-C signal intensities at non-centromeric regions (left panel) and at centromeres (right panel) in the metaphase plate of HeLa FRT/TO mCherry-CENP-A cells untreated or treated with 0.1 μg/ml of tetracycline. Each circle represents a spot or a centromere and ‘n’ or ‘Kts’ denotes number of spots or centromeres analyzed in certain number of cells as denoted by ‘cells’. Red horizontal lines represent mean signal intensities as indicated. Error bars represent standard error of mean (SEM) across the kinetochores measured from at least two independent experiments. P-values calculated using the Mann-Whitney U test are indicated.
Figure 6
Figure 6. Reduced levels of CENP-T and Nuf2 at kinetochores contribute to reduced interkinetochore distance in CENP-A overexpressing cells
A. and C. CENP-T and Nuf2 do not mislocalize in CENP-A overexpressing cells. Representative immunofluorescence images of HeLa FRT/TO mCherry-CENP-A cells untreated or treated with 0.1 μg/ml tetracycline show normal localization of CENP-T (A) and Nuf2 (C), along with CENP-A. Cells were immunostained with indicated antibodies. Scale bar is 5 μm. B. and C. CENP-T and Nuf2 levels are reduced at the centromere and kinetochore, respectively in CENP-A overexpressing cells. Prism graphs show signal intensities of CENP-T at centromeres (B) and Nuf2 at kinetochores D. in metaphase plates of HeLa FRT/TO mCherry-CENP-A cells untreated or treated with 0.1 μg/ml of tetracycline. Each circle represents each centromere (for B) or kinetochore (for D) and ‘Kts’ denotes number of centromeres or kinetochores analyzed in certain number of cells as denoted by ‘cells’. E. Interkinetochore distance is reduced in CENP-A overexpressing cells. Representative immunostained images of HeLa FRT/TO mCherry-CENP-A cells untreated or treated with 0.1 μg/ml of tetracycline show interkinetochore distance. Prior to immunostaining, cells were treated with 10 μM MG132 for 3 hours. Cells were then immunostained with antibodies against CENP-A, Nuf2 as outer kinetochore marker, CREST antisera for centromeres and stained with DAPI for DNA. Insets correspond to red boxed areas in main images. White boxed areas in insets show examples for kinetochore pairs included in analysis. Scale bar is 5 μm. F. Prism graph shows interkinetochore distance ascertained by distance between two Nuf2 signals within aligned chromosomes in MG132-arrested HeLa FRT/TO mCherry-CENP-A cells untreated or treated with 0.1 μg/ml tetracycline. Each circle represents each kinetochore pair and ‘Kts’ denotes number of kinetochore pairs analyzed in certain number of cells as denoted by ‘cells’. Red horizontal lines represent mean signal intensities (B and D) or mean interkinetochore distance (F) as indicated. Error bars represent standard error of mean (SEM) across kinetochores measured from at least two independent experiments. P-values calculated using the Mann-Whitney U test are indicated.
Figure 7
Figure 7. Depletion of DAXX prevents mislocalization of CENP-A and rescues chromosome segregation defects in CENP-A overexpressing cells
A. DAXX is efficiently depleted in DAXX siRNA-treated cells. Immunoblot shows DAXX levels in cell lysates treated with siRNAs as indicated. HeLa YFP-CENP-A cells were treated with siRNAs as indicated for 72 hours. Cell lysates were collected using 2x laemmli buffer for western blot analysis. Blots were probed with anti-DAXX Ab to assess depletion efficiency of DAXX following treatment with DAXX siRNA oligo. Anti-tubulin Ab was used as a loading control. B. DAXX depletion prevents CENP-A mislocalization. Representative images of chromosomes show expression and localization of YFP-CENP-A in HeLa YFP-CENP-A cells treated with siRNAs as indicated. Chromosome spreads were prepared and immunostained with antibody against GFP to visualize CENP-A and stained with DAPI for DNA. Cells were then imaged and analyzed for YFP-CENP-A localization. Scale bar: 1 μm. C. CENP-A levels are reduced in non-centromeric regions following DAXX depletion. Prism graphs show CENP-C signal intensities at non-centromeric regions (left) and at centromeres (right) in chromosome spreads of HeLa YFP-CENP-A cells treated with siRNAs as indicated. Each circle represents a spot and ‘n’ denotes number of spots analyzed. Red horizontal lines represent mean signal intensities as indicated. Error bars represent standard error of mean (SEM) across the areas measured. P-values calculated using the Mann-Whitney U test are indicated. # represents statistically insignificant values. D. DAXX depletion suppresses chromosome segregation defects. Bar chart graph shows proportion of HeLa YFP-CENP-A cells with defective chromosome segregation in different conditions. Error bar represents standard error of mean across three independent experiments. ‘n’ denotes number of cells analyzed. P value calculated using proportion test is indicated.
Figure 8
Figure 8. Depletion of DAXX rescues reduced interkinetochore distance in CENP-A overexpressing cells
A. DAXX is efficiently depleted in DAXX siRNA-treated cells. Immunoblot shows DAXX levels in cell lysates treated with siRNAs as indicated. HeLa YFP-CENP-A cells were treated with siRNAs as indicated for 72 hours. Cell lysates were collected using 2x laemmli buffer for western blot analysis. Blots were probed with anti-DAXX Ab to assess depletion efficiency of DAXX following treatment with DAXX siRNA oligo. Anti-tubulin Ab was used as a loading control. B. DAXX depletion rescues reduced interkinetochore distance in CENP-A overexpressing cells. Representative immunostained images of HeLa YFP CENP-A cells treated with negative or DAXX siRNA oligos. Prior to immunostaining, cells were treated with 10 μM MG132 for 3 hours. Cells were then immunostained with antibodies against CENP-A, CREST antisera for centromeres and stained with DAPI for DNA. Insets correspond to red boxed areas in main images. White boxed areas in insets show examples of kinetochore pairs included in analysis. C. Prism graph shows interkinetochore distance ascertained by distance between two CENP-A signals within aligned chromosomes in MG132-arrested HeLa YFP CENP-A cells treated with negative or DAXX siRNA oliogs. Each circle represents a kinetochore pair and ‘Kts’ denotes number of kinetochore pairs analyzed in certain number of cells as denoted by ‘cells’. Red horizontal lines represent mean interkinetochore distance as indicated. Error bars represent standard error of mean (SEM) across kinetochores measured from at least two independent experiments. P-values calculated using the Mann-Whitney U test are indicated.
Figure 9
Figure 9. Model illustrating mislocalization of CENP-A contributes to a CIN phenotype
In wild type cells, functional kinetochores provide efficient pulling forces (solid arrows) for separation of sister chromatids during metaphase to anaphase (A) thereby ensuring normal segregation (B). Mislocalization of CENP-A results in reduced levels of CENP-T and Nuf2, at kinetochores thereby weakening of the native kinetochores as reflected by the reduced interkinetochore distance (C) and leading to defective chromosome segregation (D). Depletion of DAXX prevents the mislocalization of CENP-A and rescues chromosome segregation defects in CENP-A overexpressing cells (E).

Similar articles

Cited by

References

    1. Weaver BA, Cleveland DW. Does Anauploidy cause cancer? Curr Opin Cell Biol. 2006;18:658–67. 0.1016/j.ceb.2006.10.002. - PubMed
    1. Holland AJ, Cleveland DW. Losing balance: the origin and impact of aneuploidy in cancer. EMBO Rep. 2012;13:501–14. doi: 10.1038/embor.2012.55. - DOI - PMC - PubMed
    1. Lengauer C, Kinzler KW, Vogelstein B. Genetic Instability in colorectal cancers. Nature. 1997;386:623–7. doi: 10.1038/386623a0. - DOI - PubMed
    1. Bakhoum SF, Swanton C. Chromosomal instability, aneuploidy, and cancer. Front Oncol. 2014;4:161. doi: 10.3389/fonc.2014.00161. - DOI - PMC - PubMed
    1. Branzei D, Foiani M. Regulation of DNA repair throughout the cell cycle. Nat Rev Mol Cell Biol. 2008;9:297–308. doi: 10.1038/nrm2351. - DOI - PubMed

LinkOut - more resources