. 2017 Jun 8;7(1):3057.
doi: 10.1038/s41598-017-03130-z.

Indoxyl sulfate (IS)-mediated immune dysfunction provokes endothelial damage in patients with end-stage renal disease (ESRD)

Affiliations

Indoxyl sulfate (IS)-mediated immune dysfunction provokes endothelial damage in patients with end-stage renal disease (ESRD)

Hee Young Kim et al. Sci Rep. .

Abstract

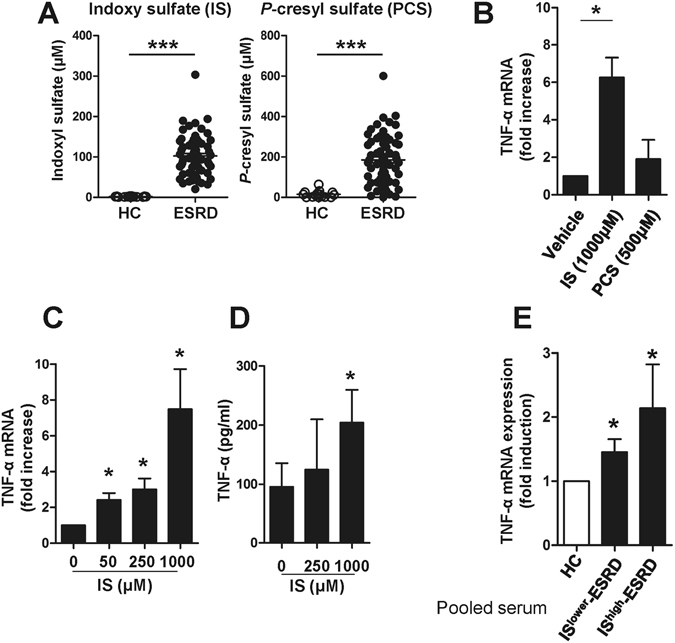
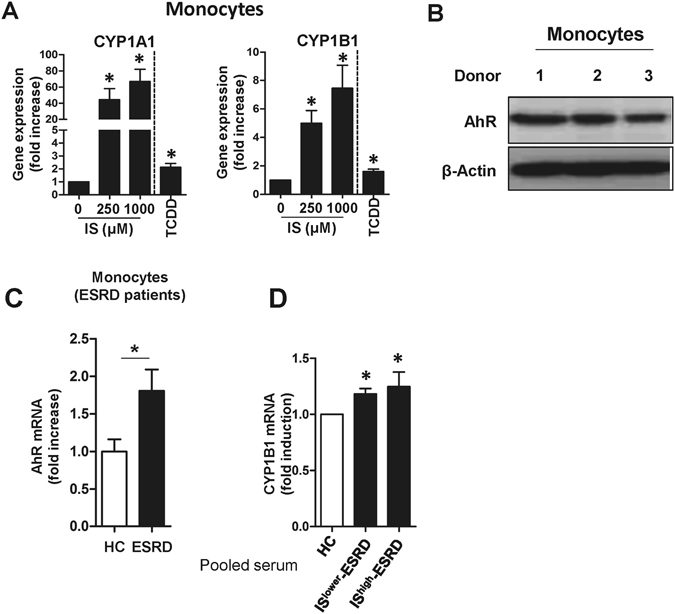
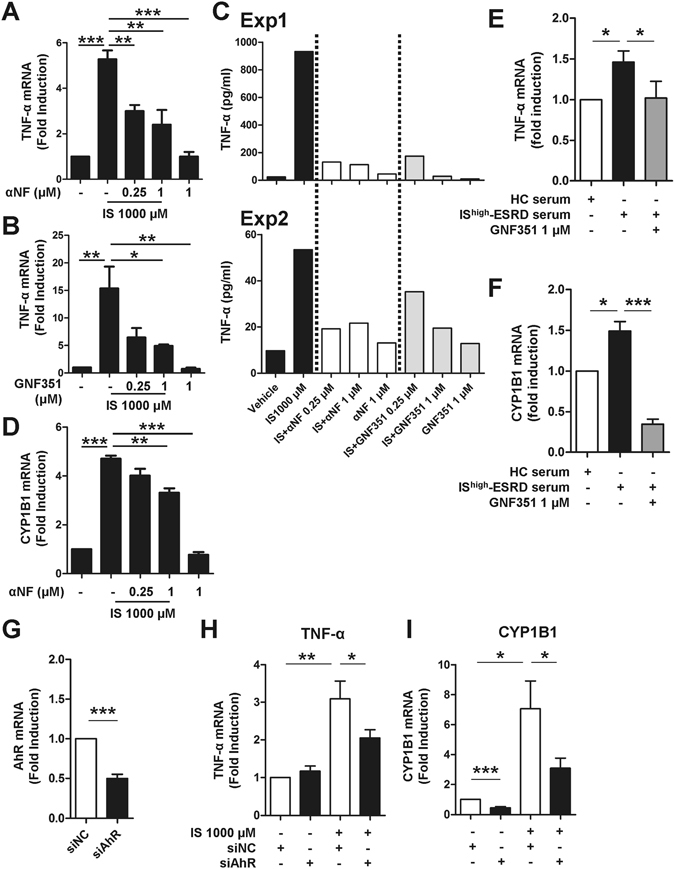
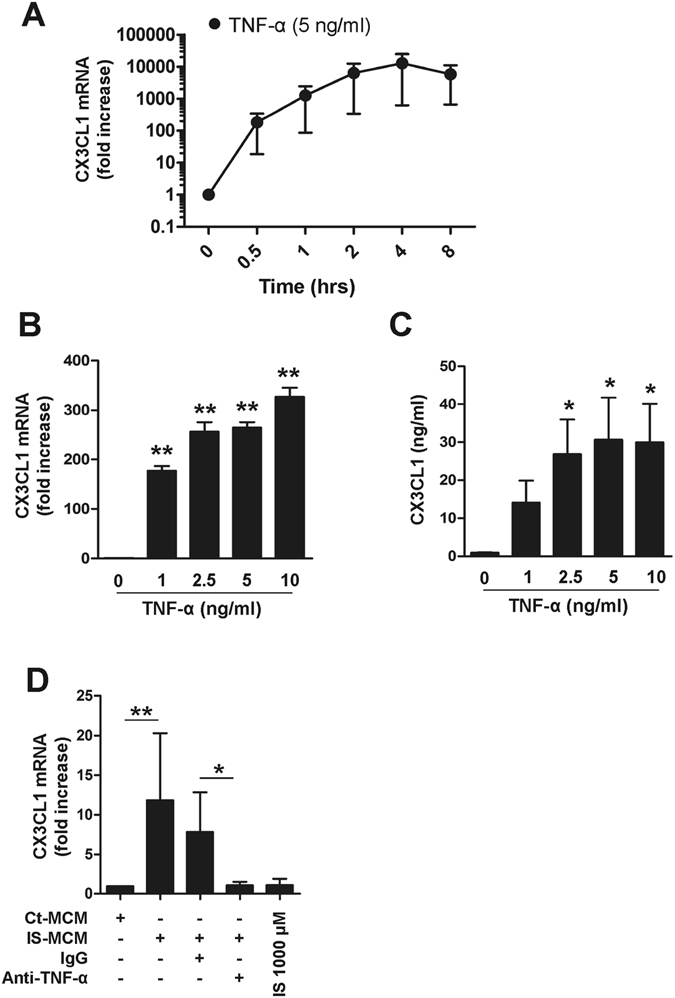
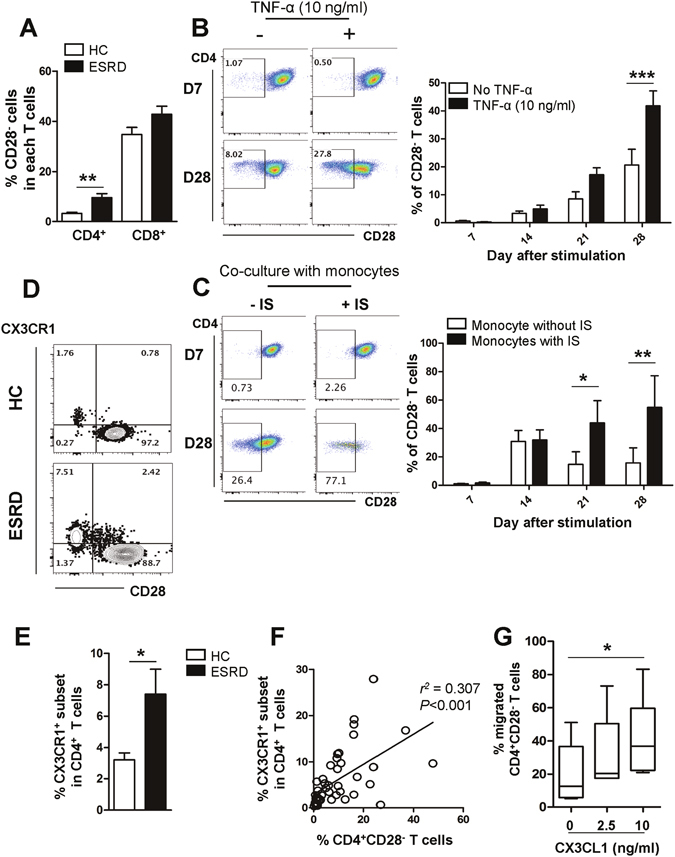
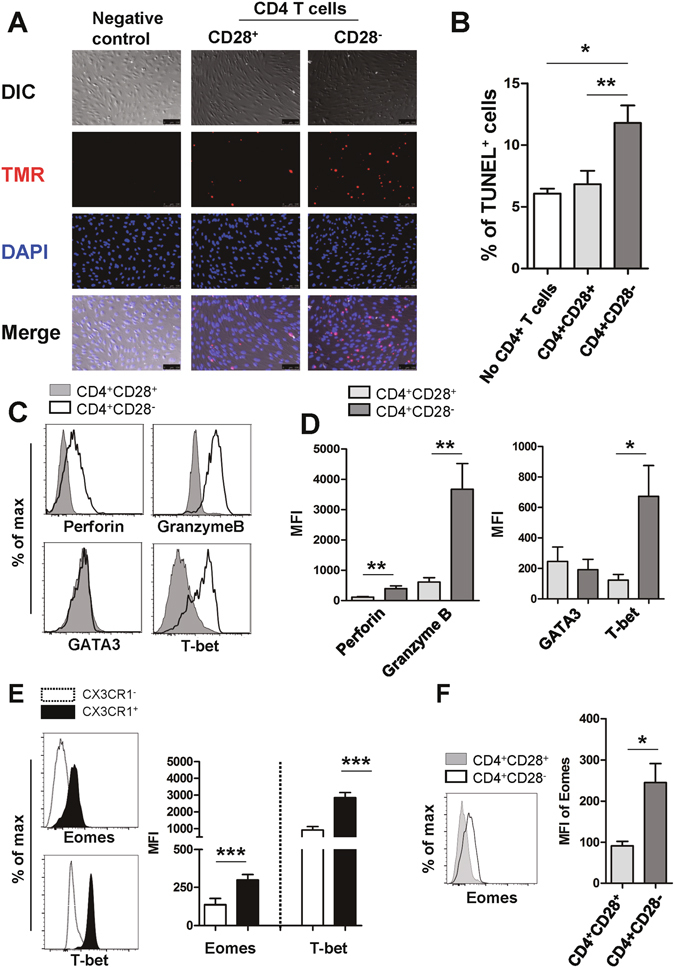
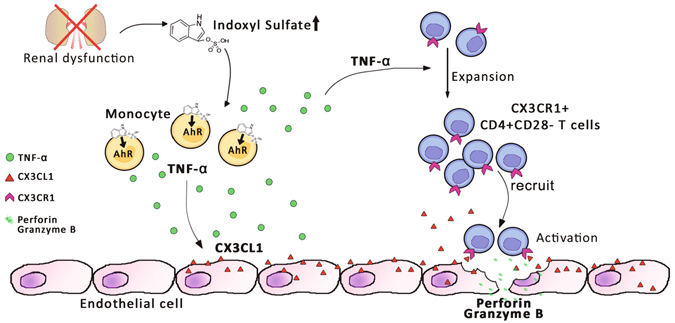
Progressive renal failure causes uremia-related immune dysfunction, which features a chronic inflammatory milieu. Given the central role of end-stage renal disease (ESRD)-related immune dysfunction in the pathogenesis of cardiovascular diseases (CVDs), much attention has been focused on how uremic toxins affect cellular immunity and the mechanisms underlying pathogenesis of atherosclerosis in ESRD patients. Here, we investigated the characteristics of monocytes and CD4+ T cells in ESRD patients and the immune responses induced by indoxyl sulfate (IS), a key uremic toxin, in order to explore the pathogenic effects of these cells on vascular endothelial cells. In ESRD patients, monocytes respond to IS through the aryl hydrocarbon receptor (AhR) and consequently produce increased levels of TNF-α. Upon stimulation with TNF-α, human vascular endothelial cells produce copious amounts of CX3CL1, a chemokine ligand of CX3CR1 that is highly expressed on CD4+CD28-T cells, the predominantly expanded cell type in ESRD patients. A migration assay showed that CD4+CD28- T cells were preferentially recruited by CX3CL1. Moreover, activated CD4+CD28- T cells exhibited cytotoxic capability allowing for the induction of apoptosis in HUVECs. Our findings suggest that in ESRD, IS-mediated immune dysfunction may cause vascular endothelial cell damage and thus, this toxin plays a pivotal role in the pathogenesis of CVD.


Conflict of interest statement

The authors declare that they have no competing interests.

Figures

Figure 1
Figure 1
Indoxyl sulfate (IS), a uremic toxin, induces production of TNF-α by human monocytes. (A) Serum indoxyl sulfate (IS) and p-cresyl sulfate (PCS) levels in ESRD patients (n = 64) and healthy controls (n = 15) were quantified using liquid chromatography–tandem mass spectrometry (LC–MS/MS). (B) Purified monocytes were stimulated with 1,000 μM of IS or 500 μM of PCS for 24 hr and then TNF-α mRNA expression was analyzed by real-time RT-PCR. (C and D) Purified monocytes were stimulated with IS at the indicated concentrations. The expression of TNF-α mRNA was analyzed by real-time RT-PCR after a 24 hr stimulation (C) and its protein level was quantified by ELISA at 48 hr post-stimulation (D). (E) Sera were pooled from patients with the top 10 (IShigher-ESRD) and bottom 10 (ISlower-ESRD) IS serum concentrations, respectively. As a control, sera from healthy controls were pooled. Monocytes isolated from healthy controls were treated with 30% (v/v) of the indicated sera for 24 hr and TNF-α mRNA expression was analyzed by real-time RT-PCR. Expression of β-actin was used as a normalization control. Bar graphs and scatter plot show the mean ± SEM of three (B), five to seven (C and D), and four (E) independent experiments. *p < 0.05, **p < 0.01, and ***p < 0.001 by two-tailed unpaired (A) or paired t-test (B,C,D and E).
Figure 2
Figure 2
Indoxyl sulfate (IS) is a potent agonist for the AhR on human monocytes. (A) Purified monocytes from HCs were treated with IS at the indicated concentration for 24 hr, and the expression of AhR responsive genes CYP1A1 (left panel) and CYP1B1 (right panel) were analyzed by real-time RT-PCR. TCDD was used as a positive agonist control. (B) Western blot analysis of AhR in monocytes freshly isolated from peripheral blood of HCs (n = 3). (C) CD14+ monocytes were freshly isolated from ESRD patients (n = 4) and age-matched HCs (n = 4) and the expression of AhR mRNA was analyzed by real-time RT-PCR. (D) Monocytes isolated from healthy controls were treated with 30% (v/v) of the indicated sera for 24 hr and CYP1B1 mRNA expression was analyzed by real-time RT-PCR. Expression of β-actin was used as a normalization control (A, C and D). Bar graphs show the mean ± SEM of five (A) or four (D) independent experiments. *p < 0.05: compared to no treatment group and HCs by two-tailed paired (A and D) and unpaired t-test (C), respectively.
Figure 3
Figure 3
IS-induced TNF-α expression is regulated through AhR activation in human monocytes. Monocytes were co-treated with IS and AhR antagonists, α-NF or GNF351, at the indicated concentration for 24 or 48 hr. (A and B) At 24 hr post-treatment, TNF-α mRNA expression was analyzed by real-time RT-PCR. (C) At 48 hr post-treatment, the amount of TNF-α in the culture supernatant was quantified by ELISA. Two representative experiments of five are shown. (D) At 24 hr post-treatment, CYP1B1 mRNA expression was analyzed by real-time RT-PCR. Expression of β-actin was used as a normalization control. (E and F) Sera were pooled from patients with the top 10 (IShigher-ESRD) IS serum concentrations. As a control, sera from healthy controls were pooled. Monocytes isolated from healthy controls were treated with 30% (v/v) of the indicated sera for 24 hr with or without 1 μM of GNF351. Gene expression levels were analyzed by real-time RT-PCR. (G) Knockdown efficiency of AhR. Freshly purified total monocytes were transfected with AhR-specific or control siRNA (20 pmol of both siRNAs). AhR mRNA expression was analyzed at 24 hr after transfection by real-time RT-PCR. (H and I) siRNA transfected monocytes were treated with IS for 24 hr. Real-time RT-PCR was performed for analysis of TNF-α and CYP1B1 mRNA expression. Expression of β-actin was used as a normalization control. Bar graphs show the mean ± SEM of five (A) or four (B and D) or six (EI) independent experiments. *p < 0.05, **p < 0.01, and ***p < 0.001 by one way ANOVA (A,B and D) and by two-tailed paired t-test (E–I), respectively.
Figure 4
Figure 4
TNF-α markedly upregulates CX3CL1 production by HUVECs. (A) HUVECs were stimulated with TNF-α (5 ng/ml) up to 8 hours and CX3CL1 mRNA expression was analyzed by real-time RT-PCR at the indicated time-points. (B) HUVECs were treated with various concentrations of TNF-α (1 to 10 ng/ml) for 4 hours, and the expression of CX3CL1 was analyzed by real-time RT-PCR. (C) HUVECs were stimulated with various concentrations of TNF-α (1 to 10 ng/ml) for 18 hours and the amount of CX3CL1 in the culture supernatant was quantified by conventional ELISA. (D) Purified monocytes were treated with or without IS for 48 hr, and the supernatant (MCM: monocyte-conditioned media) of each culture was harvested. Control or IS-treated monocyte-conditioned media (Con- or IS-MCM) was added to confluent, cultured HUVECs in the presence of anti-TNF-α Ab or control IgG, followed by a 4 hr incubation. CX3CL1 mRNA expression in treated HUVECs was analyzed by real-time RT-PCR. Expression of β-actin was used as a normalization control. Bar graphs show the mean ± SEM of three to four independent experiments. *p < 0.05 and **p < 0.01: compared to no TNF-α treatment group by two-tailed paired t-test (B and C).
Figure 5
Figure 5
CD4+CD28 T cells expressing CX3CR1, a receptor for CX3CL1, are expanded under the TNF-α rich environment in ESRD patients. (A) Frequencies (%) of CD28 cells in CD4+ and CD8+ T cells in ESRD patients (n = 50) and age-matched HCs (n = 28). (B) Purified CD4+CD28+ cells from ESRD patients were stimulated with α-CD3/CD28 Ab-coated beads and IL-2 in the absence or presence of TNF-α. At 4 days, beads were removed using a magnet and the cytokines were re-supplemented every 3–4 days. CD28 expression was analyzed every 7 days by flow cytometry. Representative FACS plot of change in CD28 expression on cultured CD4+CD28+ T cells in ESRD patients under indicated culture conditions (Left). On the indicated day, cultured cells were harvested and the frequency of CD28 cells was determined by flow cytometry (n = 4) (Right). (C) Purified naive CD4+ T cells were stimulated with α-CD3/CD28 Ab-coated beads and IL-2. At 4 days, beads were removed using a magnet and the cell were co-cultured with monocytes, which were stimulated with IS (1,000 μM) for 24 hr. IS-stimulated CD14+ monocytes were re-supplemented every 3–4 days. CD28 expression was analyzed every 7 days by flow cytometry. Representative FACS plot of change in CD28 expression on cultured naive CD4+ T cells under indicated culture conditions (Left). On the indicated day, cultured cells were harvested and the frequency of CD28 cells was determined by flow cytometry (n = 3) (Right). (D) Representative contour plot of CX3CR1 expression on CD4+CD28+ and CD4+CD28 T cells from ESRD patients and HCs (E) Expanded CX3CR1+CD4+ T cells in patients with ESRD compared with HCs. (F) Frequency (%) of CX3CR1+ cells positively correlates with the frequency of CD28 cells in CD4+ T cells of ESRD patients (n = 46). Each data point represents an individual subject. (G) Freshly-purified CD4+ memory T cells from ESRD patients were stained with APC-conjugated anti-CD28 mAb and a chemotaxis assay was performed at various concentrations of CX3CL1 (0 to 10 ng/ml) for 2 hours using a transwell system. The frequency (%) of CD28 T cells in migrated cells at various concentrations of CX3CL1 was analyzed by flow cytometry. Bar graphs show the mean ± SEM. *p < 0.05, **p < 0.01, and ***p < 0.005 by two-tailed unpaired t-test (A and E) or 2 way ANOVA test (B and C). P value in (F) was obtained using the Pearson correlation analysis. Box plots displaying medians, 25th and 75th percentiles as boxes, and minimum and maximum values as whiskers (n = 6). *p < 0.05 by two-tailed paired non-parametric test (G).
Figure 6
Figure 6
CD4+CD28 T cells have features typical of cytotoxic T cells and induce death in HUVECs in response to TCR stimulation. (A) Activated CD4+CD28 T cells induce death of HUVECs. HUVECs were pre-treated with IFN-γ (2,000 U/ml) for 48 hours and co-cultured with purified CD4+CD28 T cells or CD4+CD28+ T cells in the presence of superantigen, SEB (10 ng/ml), and TSST-1 (10 ng/ml) for TCR stimulation. The level of cell death was analyzed by TUNEL assay. The nuclei in TUNEL+ apoptotic cells were detected by TMR (red) and DAPI (blue) was used for nuclei staining of HUVECs. Data is representative of four independent experiments. At least three images were analyzed in each group. Scale bar equals 100 μm. (B) Frequencies (%) of apoptotic cells among three treatment groups. (C) Representative histogram plot of cytotoxic granules (perforin and granzyme B) and transcription factors (GATA3 and T-bet) in CD4+CD28+ and CD4+CD28 T cells from ESRD patients. (D) MFIs (mean fluorescent intensities) of cytotoxic granules and transcription factors were compared between CD4+CD28+ and CD4+CD28 T cells (n = 11) (E) Representative histogram plot (Left panel) and MFIs (Right panel) of transcription factors, Eomes and T-bet in CX3CR1+ and CX3CR1 CD4+ T cells from ESRD patients (n = 5). (F) Representative histogram plot (Left panel) and MFIs (Right panel) of Eomes in CD4+CD28+ and CD4+CD28 T cells from ESRD patients (n = 5). *p < 0.05, **p < 0.01 and ***p < 0.005 by two-tailed paired t-test.
Figure 7
Figure 7
Proposed model of IS-mediated immune dysfunction provoking endothelial damage in ESRD patients. IS, a key uremic toxin which is dramatically accumulated in patients with chronic renal dysfunction, induces secretion of TNF-α by human monocytes through the aryl hydrocarbon receptor (AhR). Upon stimulation with TNF-α, human endothelial cells predominantly produce CX3CL1, a specific chemokine ligand of CX3CR1, which is highly expressed on CD4+CD28 T cells. ESRD patients have a markedly higher frequency of circulating cytolytic CD4+CD28 T cells, which are significantly expanded under chronic exposure to TNF-α. These CD4+CD28CX3CR1+ T cells are preferentially recruited by CX3CL1 and induce apoptosis of human endothelial cells upon TCR activation.

References

    1. Betjes MG. Immune cell dysfunction and inflammation in end-stage renal disease. Nature reviews. Nephrology. 2013;9:255–265. doi: 10.1038/nrneph.2013.44. - DOI - PubMed
    1. Girndt M, Sester M, Sester U, Kaul H, Kohler H. Molecular aspects of T- and B-cell function in uremia. Kidney international. Supplement. 2001;78:S206–211. doi: 10.1046/j.1523-1755.2001.59780206.x. - DOI - PubMed
    1. Meier P, Dayer E, Blanc E, Wauters JP. Early T cell activation correlates with expression of apoptosis markers in patients with end-stage renal disease. Journal of the American Society of Nephrology: JASN. 2002;13:204–212. - PubMed
    1. Sarnak MJ, Jaber BL. Mortality caused by sepsis in patients with end-stage renal disease compared with the general population. Kidney international. 2000;58:1758–1764. doi: 10.1111/j.1523-1755.2000.00337.x. - DOI - PubMed
    1. Verkade MA, et al. Peripheral blood dendritic cells and GM-CSF as an adjuvant for hepatitis B vaccination in hemodialysis patients. Kidney international. 2004;66:614–621. doi: 10.1111/j.1523-1755.2004.00781.x. - DOI - PubMed

Publication types

MeSH terms