

Knee subchondral bone perfusion and its relationship to marrow fat and trabeculation on multi-parametric MRI and micro-CT in experimental CKD
- PMID: 28596576
- PMCID: PMC5465086
- DOI: 10.1038/s41598-017-03059-3
Knee subchondral bone perfusion and its relationship to marrow fat and trabeculation on multi-parametric MRI and micro-CT in experimental CKD
Abstract
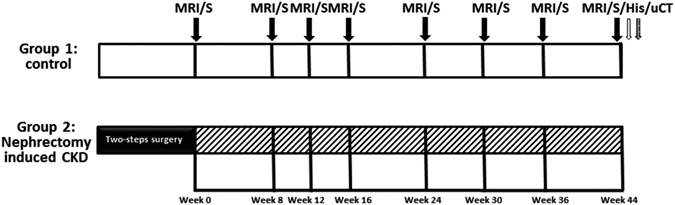
The pathogenesis of chronic kidney disease (CKD) is multifactorial. In the progression of CKD arthropathy, arteriosclerosis may alter the knee subchondral bone marrow by altering blood flow through the bone vasculature. Herein, multi-parametric MRI assessment, including dynamic contrast enhanced magnetic resonance imaging (DCE-MRI), magnetic resonance spectroscopy (MRS), MRI T2*, contrast enhanced MR angiography (CE-MRA), and micro-CT were applied in a rodent nephrectomy model to: 1) investigate the blood perfusion of subchondral bone marrow and its relationship to fat water content and trabeculation pattern in CKD and 2) demonstrate the feasibility of using multi-parametric MRI parameters as imaging biomarkers to evaluate the disease's progression. Two groups of rats in our study underwent either 1) no intervention or 2) 5/6 nephrectomy. We found that in the CKD group, perfusion amplitude A and elimination constant k el values were significantly decreased, and vascular permeability k ep was significantly increased. MRS showed that fat fraction (FF) was significantly lower, water fraction (WF) was significantly higher in the CKD group. Micro-CT showed a significant loss of trabecular bone. Knee subchondral bone marrow perfusion deficiency in experimental CKD may be associated with decreased fat content, increased water content, and sparse trabeculation.
Conflict of interest statement
The authors declare that they have no competing interests.
Figures
 ).
).


Similar articles
-
Cartilage MRI T2∗ relaxation time and perfusion changes of the knee in a 5/6 nephrectomy rat model of chronic kidney disease.Osteoarthritis Cartilage. 2017 Jun;25(6):976-985. doi: 10.1016/j.joca.2016.12.019. Epub 2016 Dec 21. Osteoarthritis Cartilage. 2017. PMID: 28011101
-
Assessment of Vertebral Bone Marrow Perfusion, Fat/Water Content, and Trabecular Bone Changes Using Multimodal MRI and Micro-CT in a Rat Model of Chronic Kidney Disease.JOR Spine. 2025 Jan 20;8(1):e70039. doi: 10.1002/jsp2.70039. eCollection 2025 Mar. JOR Spine. 2025. PMID: 39838972 Free PMC article.
-
Perfusion of subchondral bone marrow in knee osteoarthritis: A dynamic contrast-enhanced magnetic resonance imaging preliminary study.Eur J Radiol. 2017 Mar;88:129-134. doi: 10.1016/j.ejrad.2016.12.023. Epub 2016 Dec 24. Eur J Radiol. 2017. PMID: 28189197
-
Bone marrow lesions and subchondral bone pathology of the knee.Knee Surg Sports Traumatol Arthrosc. 2016 Jun;24(6):1797-814. doi: 10.1007/s00167-016-4113-2. Epub 2016 Apr 13. Knee Surg Sports Traumatol Arthrosc. 2016. PMID: 27075892 Review.
-
MRI-detected subchondral bone marrow signal alterations of the knee joint: terminology, imaging appearance, relevance and radiological differential diagnosis.Osteoarthritis Cartilage. 2009 Sep;17(9):1115-31. doi: 10.1016/j.joca.2009.03.012. Epub 2009 Mar 31. Osteoarthritis Cartilage. 2009. PMID: 19358902 Review.
Cited by
-
Hypoperfusion of the infrapatellar fat pad and its relationship to MRI T2* relaxation time changes in a 5/6 nephrectomy model.Sci Rep. 2021 May 11;11(1):9924. doi: 10.1038/s41598-021-89336-8. Sci Rep. 2021. PMID: 33976243 Free PMC article.
-
How We Manage Bone Marrow Edema-An Interdisciplinary Approach.J Clin Med. 2020 Feb 18;9(2):551. doi: 10.3390/jcm9020551. J Clin Med. 2020. PMID: 32085459 Free PMC article.
-
Disease-modifying interactions between chronic kidney disease and osteoarthritis: a new comorbid mouse model.RMD Open. 2023 Aug;9(3):e003109. doi: 10.1136/rmdopen-2023-003109. RMD Open. 2023. PMID: 37562858 Free PMC article.
References
Publication types
MeSH terms
LinkOut - more resources
Full Text Sources
Other Literature Sources
Medical
Molecular Biology Databases
