

A comprehensive analysis and annotation of human normal urinary proteome
- PMID: 28596590
- PMCID: PMC5465101
- DOI: 10.1038/s41598-017-03226-6
A comprehensive analysis and annotation of human normal urinary proteome
Abstract
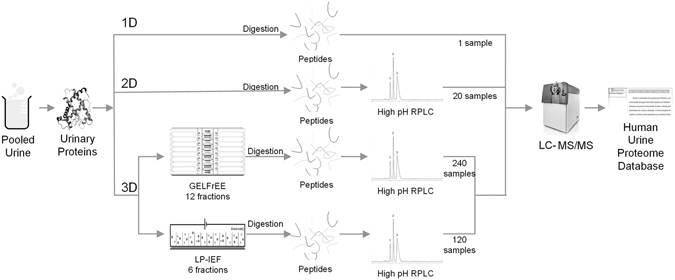
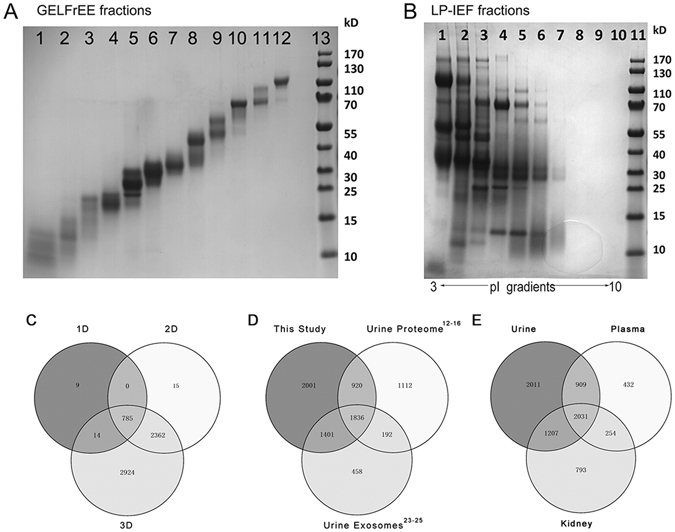
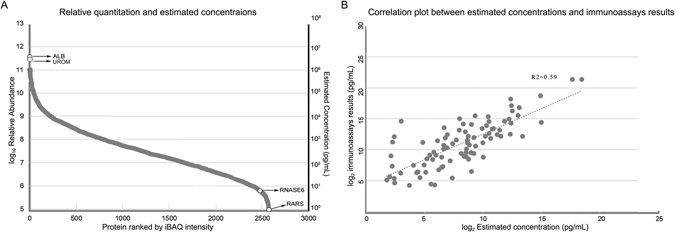
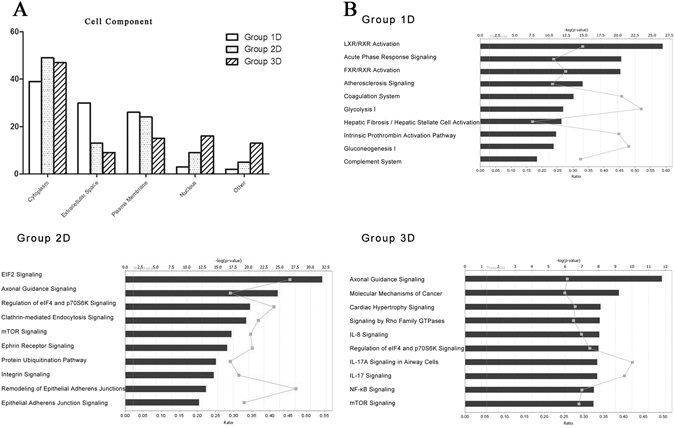
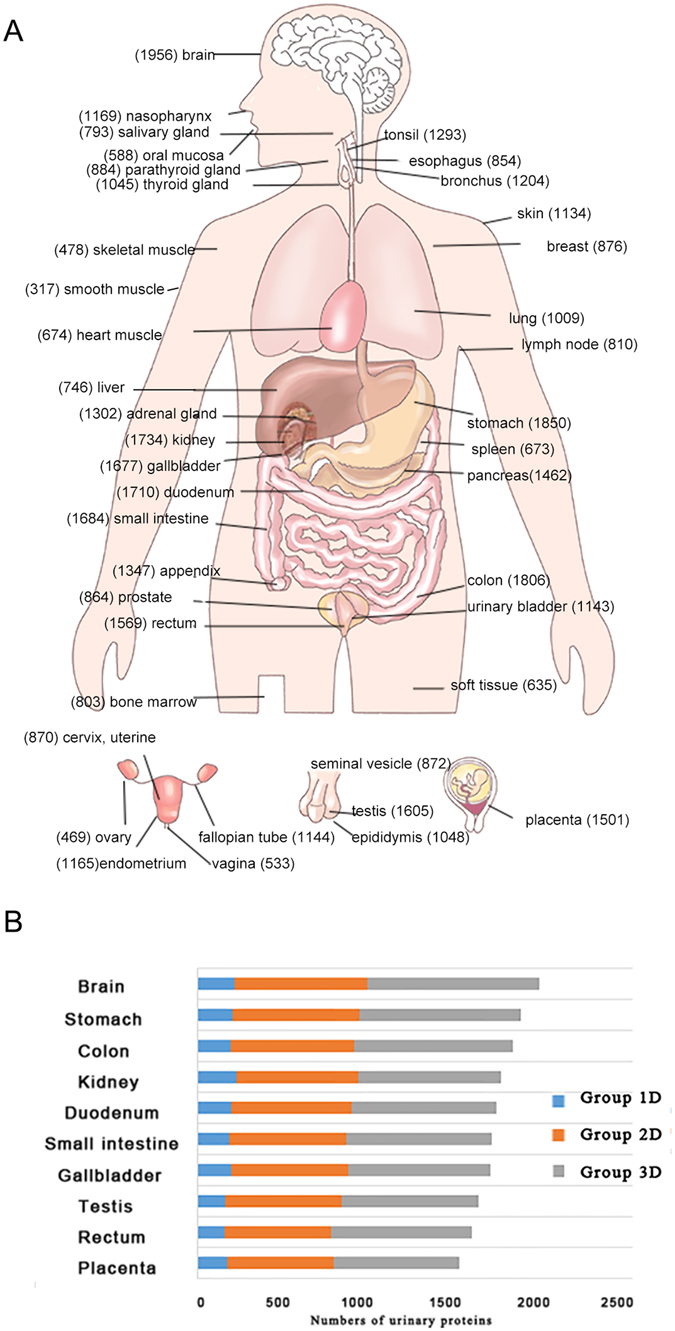
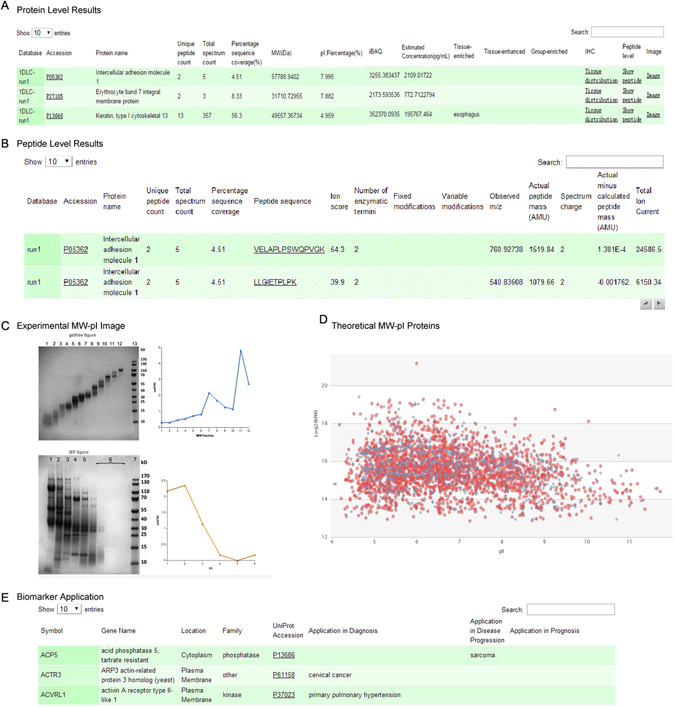
Biomarkers are measurable changes associated with the disease. Urine can reflect the changes of the body while blood is under control of the homeostatic mechanisms; thus, urine is considered an important source for early and sensitive disease biomarker discovery. A comprehensive profile of the urinary proteome will provide a basic understanding of urinary proteins. In this paper, we present an in-depth analysis of the urinary proteome based on different separation strategies, including direct one dimensional liquid chromatography-tandem mass spectrometry (LC/MS/MS), two dimensional LC/MS/MS, and gel-eluted liquid fraction entrapment electrophoresis/liquid-phase isoelectric focusing followed by two dimensional LC/MS/MS. A total of 6085 proteins were identified in healthy urine, of which 2001 were not reported in previous studies and the concentrations of 2571 proteins were estimated (spanning a magnitude of 106) with an intensity-based absolute quantification algorithm. The urinary proteins were annotated by their tissue distribution. Detailed information can be accessed at the "Human Urine Proteome Database" (www.urimarker.com/urine).
Conflict of interest statement
The authors declare that they have no competing interests.
Figures
Similar articles
-
Mining the acidic serum proteome utilizing off-gel isoelectric focusing and label free quantitative liquid chromatography mass spectrometry.J Chromatogr A. 2018 Sep 7;1566:32-43. doi: 10.1016/j.chroma.2018.06.044. Epub 2018 Jun 19. J Chromatogr A. 2018. PMID: 29945787
-
Proteomic analysis reveals differentially secreted proteins in the urine from patients with clear cell renal cell carcinoma.Urol Oncol. 2016 Jan;34(1):5.e11-25. doi: 10.1016/j.urolonc.2015.07.016. Epub 2015 Sep 26. Urol Oncol. 2016. PMID: 26420021
-
The human urinary proteome contains more than 1500 proteins, including a large proportion of membrane proteins.Genome Biol. 2006;7(9):R80. doi: 10.1186/gb-2006-7-9-R80. Genome Biol. 2006. PMID: 16948836 Free PMC article.
-
Proteomics of the Human Olfactory Tract.OMICS. 2018 Jan;22(1):77-87. doi: 10.1089/omi.2017.0155. OMICS. 2018. PMID: 29356628 Review.
-
Flow field-flow fractionation: a pre-analytical method for proteomics.J Proteomics. 2008 Aug 21;71(3):265-76. doi: 10.1016/j.jprot.2008.06.002. Epub 2008 Jun 10. J Proteomics. 2008. PMID: 18602503 Review.
Cited by
-
Mass Spectrometric Analysis of Urine from COVID-19 Patients for Detection of SARS-CoV-2 Viral Antigen and to Study Host Response.J Proteome Res. 2021 Jul 2;20(7):3404-3413. doi: 10.1021/acs.jproteome.1c00391. Epub 2021 Jun 2. J Proteome Res. 2021. PMID: 34077217 Free PMC article.
-
Biology of the Extracellular Proteasome.Biomolecules. 2022 Apr 21;12(5):619. doi: 10.3390/biom12050619. Biomolecules. 2022. PMID: 35625547 Free PMC article. Review.
-
Spns1 is an iron transporter essential for megalin-dependent endocytosis.Am J Physiol Renal Physiol. 2024 Nov 1;327(5):F775-F787. doi: 10.1152/ajprenal.00172.2024. Epub 2024 Sep 12. Am J Physiol Renal Physiol. 2024. PMID: 39265081 Free PMC article.
-
Proteomic analysis of urine reveals biomarkers for the diagnosis and phenotyping of abdominal-type Henoch-Schonlein purpura.Transl Pediatr. 2021 Mar;10(3):510-524. doi: 10.21037/tp-20-317. Transl Pediatr. 2021. PMID: 33850810 Free PMC article.
-
Data-Independent Acquisition Mass Spectrometry of EPS-Urine Coupled to Machine Learning: A Predictive Model for Prostate Cancer.ACS Omega. 2023 Feb 7;8(7):6244-6252. doi: 10.1021/acsomega.2c05487. eCollection 2023 Feb 21. ACS Omega. 2023. PMID: 36844540 Free PMC article.
References
-
- Casey, H. W., Ayers, K. N. & Robinson, F. In Pathology of laboratory animals 115–173 (Springer, 1978).
-
- Ho J, et al. Mass spectrometry-based proteomic analysis of urine in acute kidney injury following cardiopulmonary bypass: a nested case-control study. American journal of kidney diseases: the official journal of the National Kidney Foundation. 2009;53:584–595. doi: 10.1053/j.ajkd.2008.10.037. - DOI - PubMed
Publication types
MeSH terms
Substances
LinkOut - more resources
Full Text Sources
Other Literature Sources
Medical
