. 2017 Feb 1;67(2):134-146.
doi: 10.1093/biosci/biw180.

Assessing National Biodiversity Trends for Rocky and Coral Reefs through the Integration of Citizen Science and Scientific Monitoring Programs

Affiliations

Assessing National Biodiversity Trends for Rocky and Coral Reefs through the Integration of Citizen Science and Scientific Monitoring Programs

Rick D Stuart-Smith et al. Bioscience. .

Erratum in

Abstract

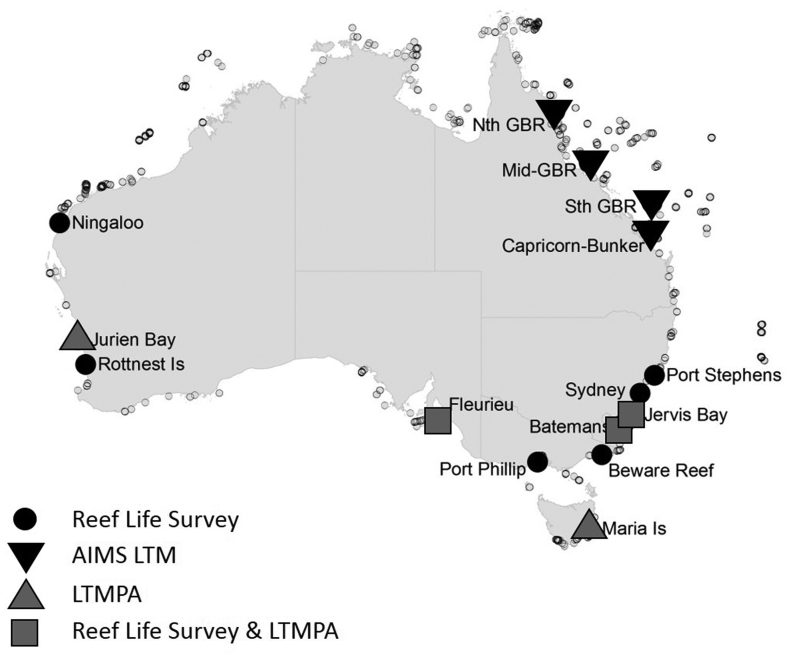
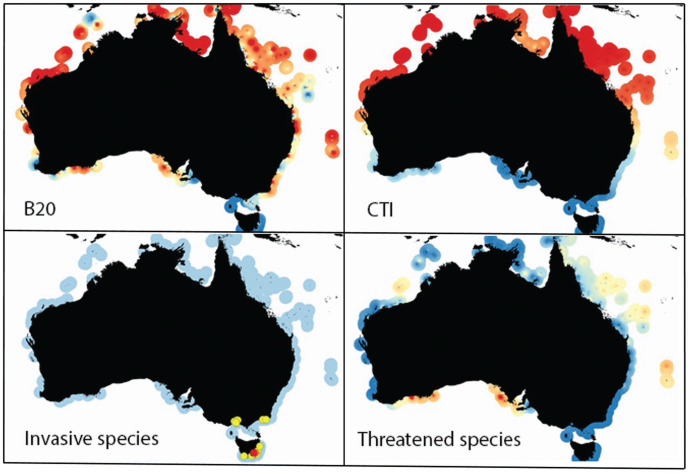
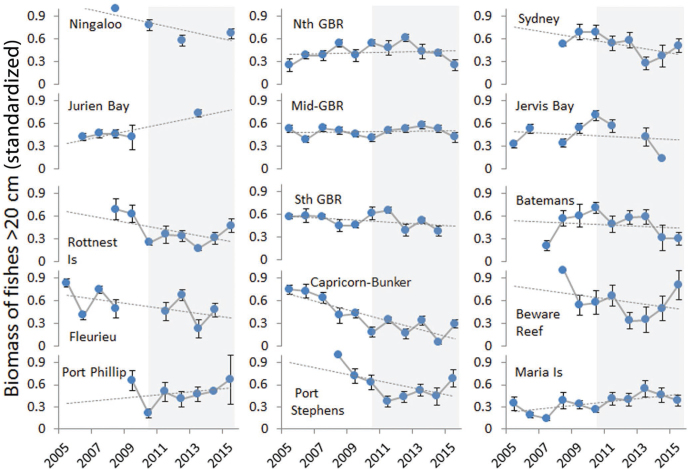
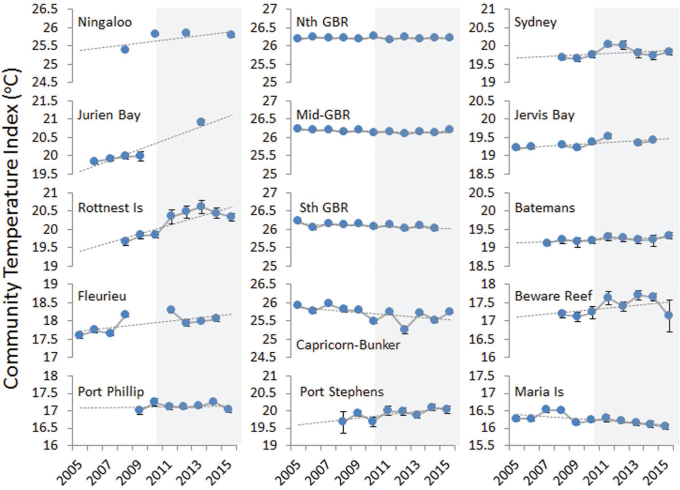
Reporting progress against targets for international biodiversity agreements is hindered by a shortage of suitable biodiversity data. We describe a cost-effective system involving Reef Life Survey citizen scientists in the systematic collection of quantitative data covering multiple phyla that can underpin numerous marine biodiversity indicators at high spatial and temporal resolution. We then summarize the findings of a continental- and decadal-scale State of the Environment assessment for rocky and coral reefs based on indicators of ecosystem state relating to fishing, ocean warming, and invasive species and describing the distribution of threatened species. Fishing impacts are widespread, whereas substantial warming-related change affected some regions between 2005 and 2015. Invasive species are concentrated near harbors in southeastern Australia, and the threatened-species index is highest for the Great Australian Bight and Tasman Sea. Our approach can be applied globally to improve reporting against biodiversity targets and enhance public and policymakers' understanding of marine biodiversity trends.

Keywords: Convention on Biological Diversity; Marine Trophic Index; community temperature index; ecological indicator; state of the environment.


Figures

Figure 1.
Figure 1.
A map of Reef Life Survey (RLS) sites surveyed from 2010 to 2015 and used in spatial analyses (small symbols, n = 1294), as well as long-term monitoring locations from RLS (n = 357), the Long-Term Temperate Marine Protected Area Monitoring (LTMPA; n = 182 sites) program, and the Australian Institute of Marine Science Long-Term Monitoring (AIMS LTM; n = 276 sites) program used for temporal trend assessment.
Figure 2.
Figure 2.
The distribution of values of indicators of reef biodiversity in relation to fishing pressure, ocean warming, invasive species, and threatened species, based on quantitative surveys of coral and rocky reefs by the Reef Life Survey program (n = 1294 sites). B20 is the total biomass of fishes 20 centimeters or larger, and CTI is the community temperature index. The CTI is calculated as a community-weighted mean of the midpoint of the realized thermal range of each species, weighted by the log of their abundance. It represents the current mean thermal affinity of reef fish communities rather than implying any warming-related change (shown in figure 3). Invasive species were only plotted for sites at which they were recorded, with yellow indicating up to 30% of individuals belonging to invasive species and red indicating values from 30% to 95% of individuals. Otherwise, the color scales are interpreted as red being the highest values in the data set and blue as the lowest (zero for invasive and threatened species). The values have been interpolated and extended to a maximum of 100 kilometers from the survey sites to enable visualization of a broader strip of color around the coastline (see supplemental material). The values only apply to shallow reef habitats within the colored areas of the maps.
Figure 3.
Figure 3.
Trends in biomass of large reef fishes (20 centimeters or greater) at monitoring locations from 2005 to 2015. The values for each site have been standardized by the maximum for that site over the time series, and the means of the standardized values among a number of sites at each location are shown (overall mean of 23 sites per location per year). The error bars represent the standard error. Long-term trends shown by the dotted gray line are linear smoothers, and background shading provides a visual reference to the middle of the period covered (5 years). The locations at which marine protected areas (MPAs) were monitored include sites within and outside MPA boundaries.
Figure 4.
Figure 4.
Trends in the community temperature index (CTI) for reef fishes at monitoring locations from 2005 to 2015. Each point represents the mean (±SE) of CTI values among sites surveyed at each location in that year (overall mean of 23 sites per location per year). The long-term trends shown by the dotted gray line are linear smoothers, and background shading provides a visual reference to the middle of the period covered (5 years). The locations at which marine protected areas (MPAs) were monitored include sites within and outside MPA boundaries.

References

    1. Andersen JH, Dahl K, Göke C, Hartvig M, Murray C, Rindorf A, Skov H, Vinther M, Korpinen S, 2014, Integrated assessment of marine biodiversity status using a prototype indicator-based assessment tool, Frontiers in Marine Science, 1art 55doi:10.3389/fmars.2014.00055
    1. Babcock RC, Shears NT, Alcala A, Barrett NS, Edgar GJ, Lafferty KD, McClanahan TR, Russ GR, 2010, Decadal trends in marine reserves reveal differential rates of change in direct and indirect effects, Proceedings of the National Academy of Sciences, 107, 18251, 18255 - PMC - PubMed
    1. Barrett NS, Buxton CD, Edgar GJ, 2009, Changes in invertebrate and macroalgal populations in Tasmanian marine reserves in the decade following protection, Journal of Experimental Marine Biology and Ecology, 370, 104, 119
    1. Bates AE, Barrett NS, Stuart-Smith RD, Holbrook NJ, Thompson PA, Edgar GJ, 2014, Resilience and signatures of tropicalization in protected reef fish communities, Nature Climate Change, 4, 62, 67
    1. Bates AE, et al. , 2015, Distinguishing geographical range shifts from artefacts of detectability and sampling effort, Diversity and Distributions, 21, 13, 22