. 2017 May 24:8:924.
doi: 10.3389/fmicb.2017.00924. eCollection 2017.

In-depth Profiling of MvfR-Regulated Small Molecules in Pseudomonas aeruginosa after Quorum Sensing Inhibitor Treatment

Affiliations

In-depth Profiling of MvfR-Regulated Small Molecules in Pseudomonas aeruginosa after Quorum Sensing Inhibitor Treatment

Giuseppe Allegretta et al. Front Microbiol. .

Abstract

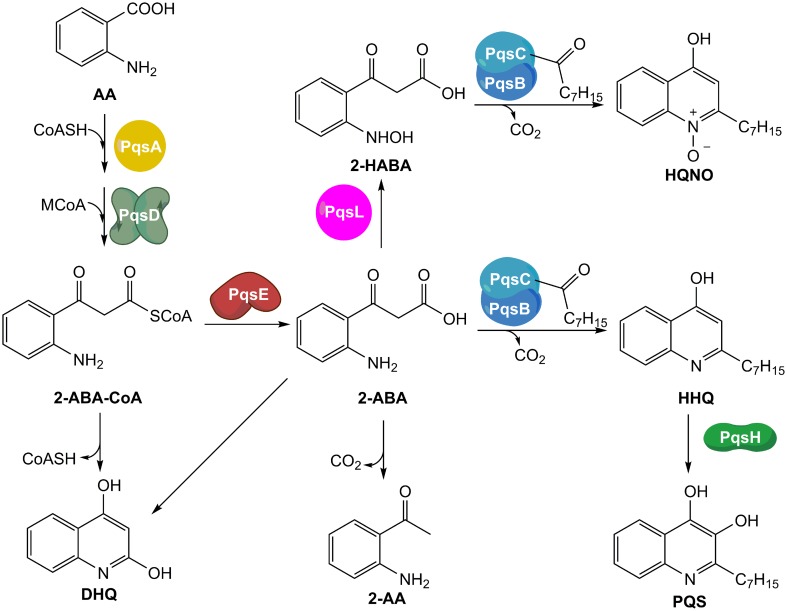
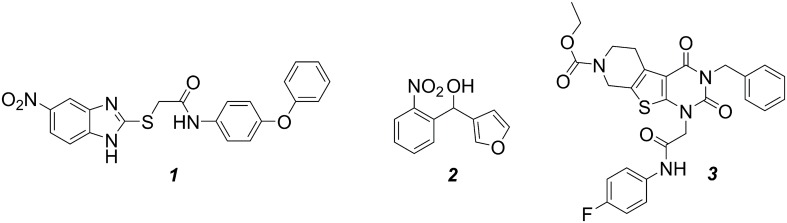
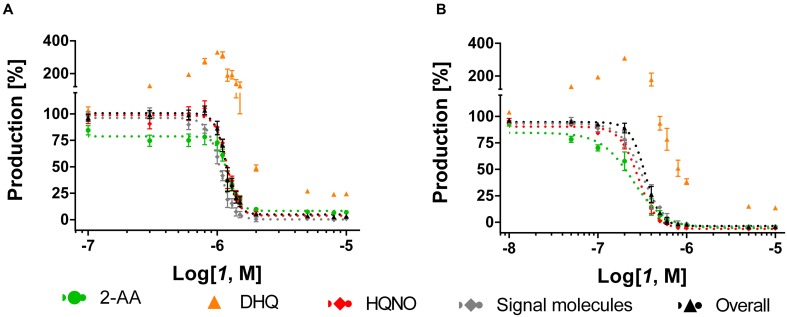
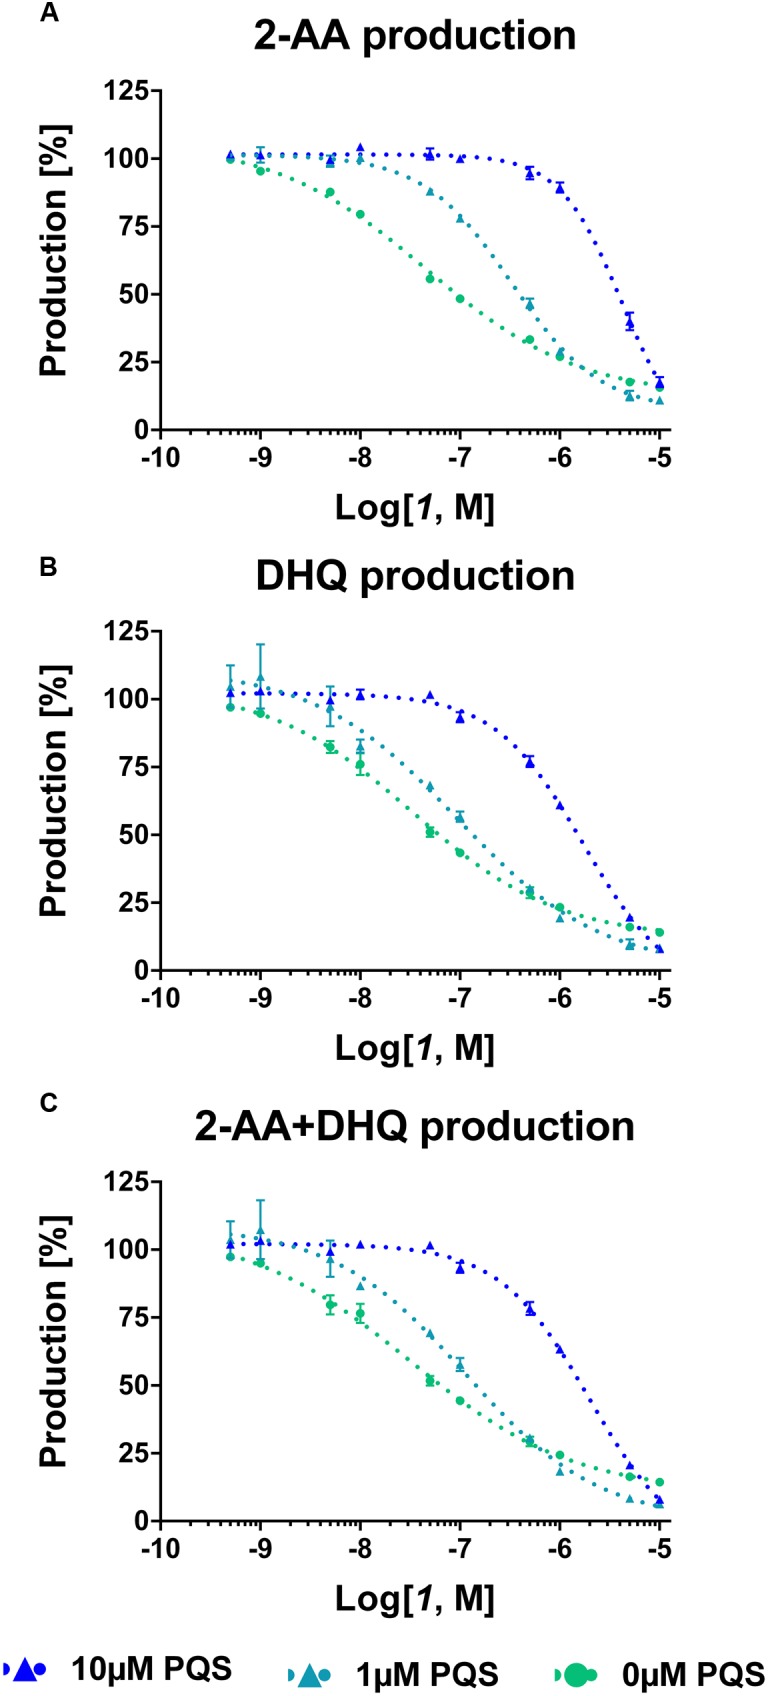
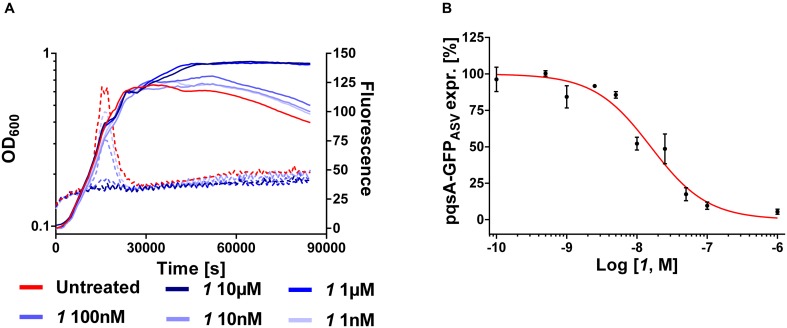
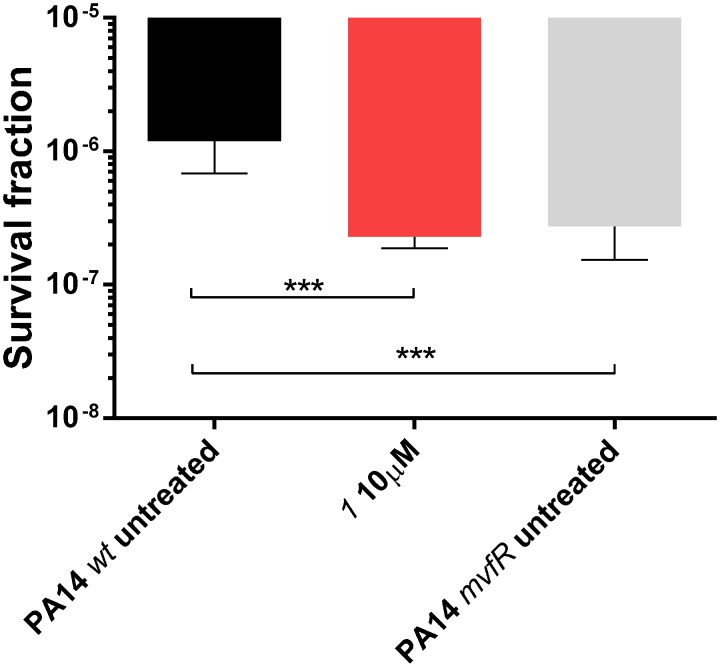
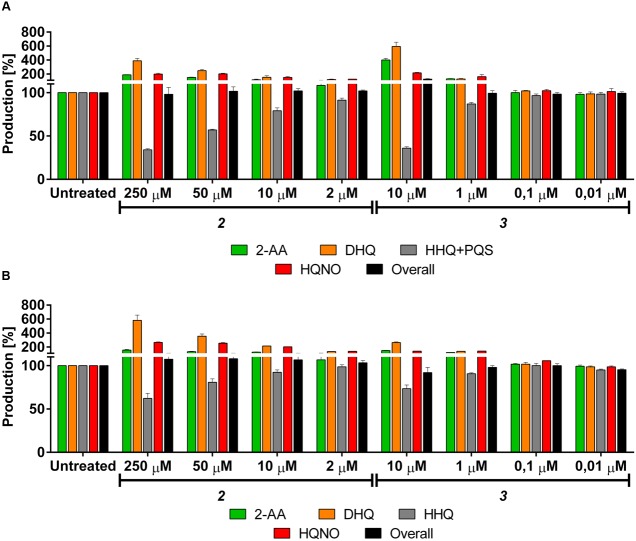
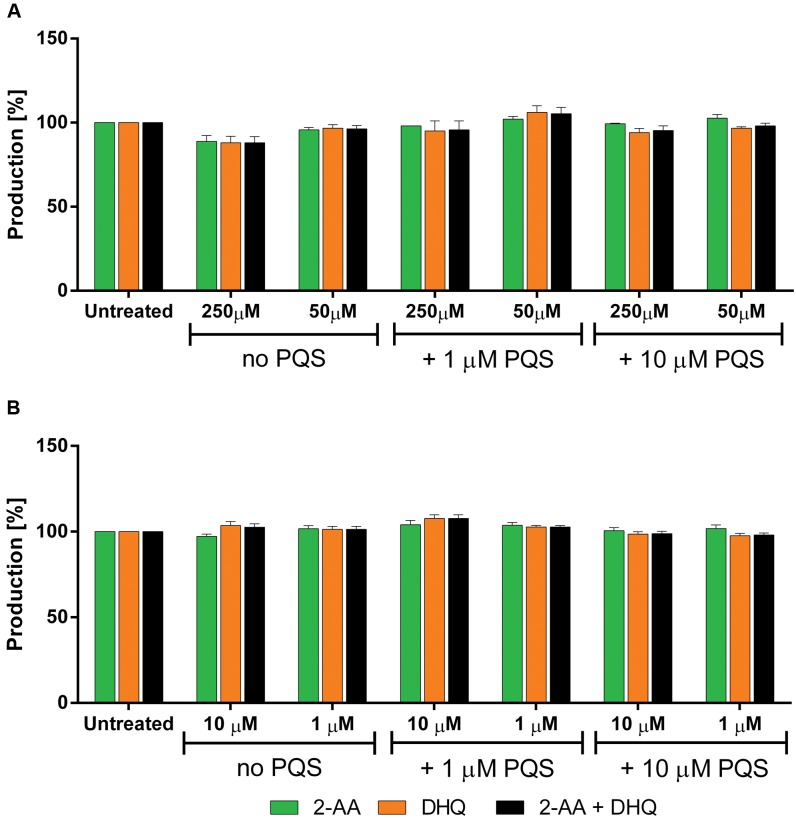
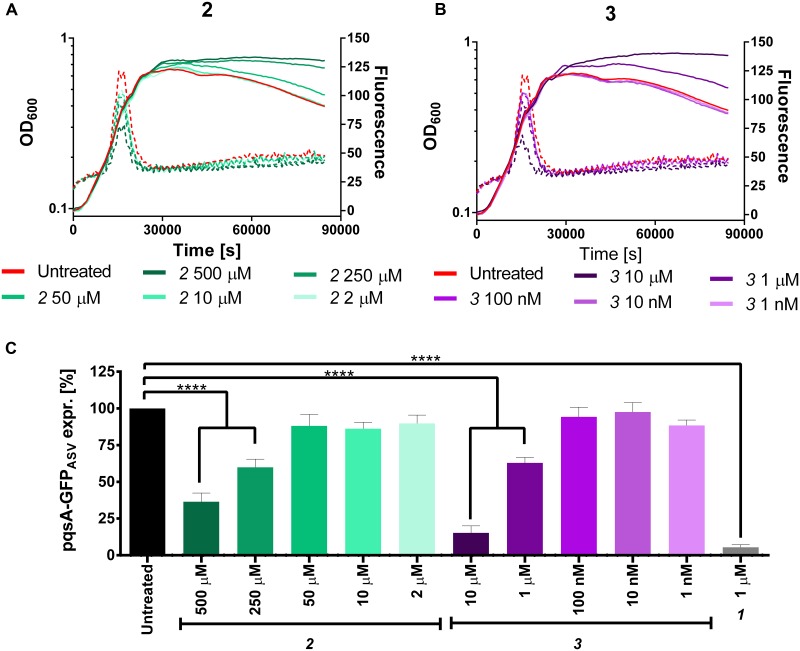
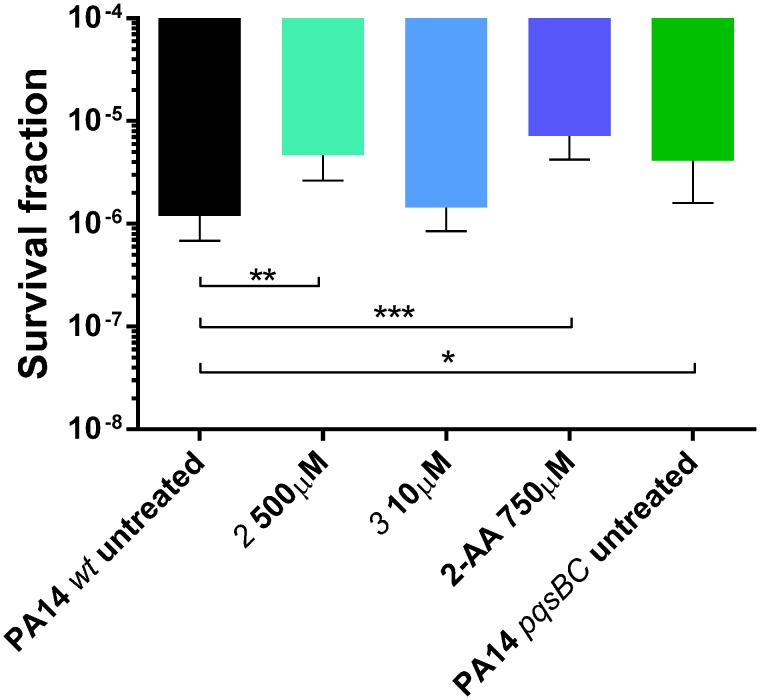
Pseudomonas aeruginosa is a Gram-negative bacterium, which causes opportunistic infections in immuno-compromised individuals. Due to its multiple resistances toward antibiotics, the development of new drugs is required. Interfering with Quorum Sensing (QS), a cell-to-cell communication system, has shown to be highly efficient in reducing P. aeruginosa pathogenicity. One of its QS systems employs Pseudomonas Quinolone Signal (PQS) and 4-hydroxy-2-heptylquinoline (HHQ) as signal molecules. Both activate the transcriptional regulator MvfR (Multiple Virulence Factor Regulator), also called PqsR, driving the production of QS molecules as well as toxins and biofilm formation. The aim of this work was to elucidate the effects of QS inhibitors (QSIs), such as MvfR antagonists and PqsBC inhibitors, on the biosynthesis of the MvfR-regulated small molecules 2'-aminoacetophenone (2-AA), dihydroxyquinoline (DHQ), HHQ, PQS, and 4-hydroxy-2-heptylquinoline-N-oxide (HQNO). The employed synthetic MvfR antagonist fully inhibited pqs small molecule formation showing expected sigmoidal dose-response curves for 2-AA, HQNO, HHQ and PQS. Surprisingly, DHQ levels were enhanced at lower antagonist concentrations followed by a full suppression at higher QSI amounts. This particular bi-phasic profile hinted at the accumulation of a biosynthetic intermediate resulting in the observed overproduction of the shunt product DHQ. Additionally, investigations on PqsBC inhibitors showed a reduction of MvfR natural ligands, while increased 2-AA, DHQ and HQNO levels compared to the untreated cells were detected. Moreover, PqsBC inhibitors did not show any significant effect in PA14 pqsC mutant demonstrating their target selectivity. As 2-AA is important for antibacterial tolerance, the QSIs were evaluated in their capability to attenuate persistence. Indeed, persister cells were reduced along with 2-AA inhibition resulting from MvfR antagonism, but not from PqsBC inhibition. In conclusion, antagonizing MvfR using a dosage capable of fully suppressing this QS system will lead to a favorable therapeutic outcome as DHQ overproduction is avoided and bacterial persistence is reduced.

Keywords: 2′-aminoacetophenone; MvfR; Pseudomonas aeruginosa; Quorum Sensing Inhibitors; dihydroxyquinoline; persistence; quinolones.


Figures

FIGURE 1
FIGURE 1
Current model of the biosynthetic pathway of MvfR-related small molecules. AA, anthranilic acid; CoASH, Coenzyme A; MCoA, malonyl-CoA; 2-ABA-CoA, 2′-aminobenzoylacetyl-CoA; 2-ABA, 2′-aminobenzoylacetate; DHQ, dihydroxyquinoline; 2-AA, 2′-aminoacetophenone; 2-HABA, 2′-hydroxylaminobenzoylacetate; HHQ, 4-hydroxy-2-heptylquinoline; HQNO, 4-hydroxy-2-heptylquinoline-N-oxide; PQS, Pseudomonas Quinolone Signal.
FIGURE 2
FIGURE 2
Structures of the compounds evaluated in this work. MvfR antagonist 1, PqsBC inhibitors 2 and 3.
FIGURE 3
FIGURE 3
Dose-response curves of MvfR antagonist 1 acting on MvfR-related small molecules production in PA14 wt (A) and PA14 pqsH mutant (B). 2-AA: green. DHQ: orange. Signal molecules: gray. HQNO: red. Sum of all anthranilic acid derivatives: black. The “x” axes indicate the logarithm of the concentration of the antagonists in molar units (M). The error bars indicate Standard Error of the Mean.
FIGURE 4
FIGURE 4
Dose-response curves of MvfR antagonist 1 on 2-AA (A), DHQ (B) and overall (C) production in PA14 pqsC mutant with and without external addition of PQS. The “x” axes indicate the logarithm of the concentration of the antagonists in molar units (M). The error bars indicate Standard Error of the Mean.
FIGURE 5
FIGURE 5
Expression of pqsA-GFPASV (dotted lines) and growth curves (solid lines) of Pseudomonas aeruginosa treated with 1(A). IC50 curve of 1 (B). The “x” axes indicate the logarithm of the concentration of the antagonists in molar units (M). The error bars indicate Standard Error of the Mean.
FIGURE 6
FIGURE 6
Persister cells survival of PA14 wt with and without MvfR antagonist 1 and PA14 mvfR mutant after the treatment with 10 μg/mL of meropenem for 24 h. The error bars indicate 95% Confidence Interval of the geometric mean. Statistical analysis performed with non-parametric one-way ANOVA (α = 0.05; ∗∗∗∗p < 0.0001; ∗∗∗p < 0.003; p < 0.05).
FIGURE 7
FIGURE 7
Effects of PqsBC inhibitors on pqs related signal molecules production in PA14 strains. (A) 2 and 3 in PA14 wt. 2-AA: green. DHQ: orange. PQS + HHQ: gray. HQNO: red. Sum of all anthranilic acid derivatives: black. (B) 2 and 3 in PA14 pqsH mutant. 2-AA: green. DHQ: orange. HHQ: gray. HQNO: red. Sum of all anthranilic acid derivatives: black. The error bars indicate Standard Error of the Mean. Statistical analysis performed with one-way ANOVA (α = 0.05).
FIGURE 8
FIGURE 8
Effects of PqsBC inhibitors on 2-AA and DHQ production in PA14 pqsC mutant. (A) 2 and (B) 3. 2-AA: green. DHQ: orange. Sum of all anthranilic acid derivatives: black. The error bars indicate Standard Error of the Mean. Statistical analysis performed with one-way ANOVA (α = 0.05).
FIGURE 9
FIGURE 9
Expression of pqsA-GFPASV (dotted lines) and growth curves (solid lines) of Pseudomonas aeruginosa treated with 2(A) and 3 (B). (C) Percentage of pqsA-GFPASV expression after PqsBC inhibitors addition. The error bars indicate Standard Error of the Mean. Statistical analysis performed with one-way ANOVA (α = 0.05; ∗∗∗∗p < 0.0001).
FIGURE 10
FIGURE 10
Persister cells survival of PA14 wt with and without PqsBC inhibitors 2 and 3, or 2-AA and PA14 pqsBC mutant after the treatment with 10 μg/mL of meropenem for 24 h. The error bars indicate 95% Confidence Interval of the geometric mean. Statistical analysis performed with non-parametric one-way ANOVA (α = 0.05; ∗∗∗p < 0.003; ∗∗p < 0.01; p < 0.05).

References

    1. Aloush V., Navon-Venezia S., Seigman-Igra Y., Cabili S., Carmeli Y. (2006). Multidrug-resistant Pseudomonas aeruginosa: risk factors and clinical impact. Antimicrob. Agents Chemother. 50 43–48. 10.1128/AAC.50.1.43-48.2006 - DOI - PMC - PubMed
    1. Déziel E., Lépine F., Milot S., He J., Mindrinos M. N., Tompkins R. G., et al. (2004). Analysis of Pseudomonas aeruginosa 4-hydroxy-2-alkylquinolines (HAQs) reveals a role for 4-hydroxy-2-heptylquinoline in cell-to-cell communication. PNAS 101 1339–1344. 10.1073/pnas.0307694100 - DOI - PMC - PubMed
    1. Drees S. L., Fetzner S. (2015). PqsE of Pseudomonas aeruginosa acts as pathway-specific thioesterase in the biosynthesis of alkylquinolone signaling molecules. Chem. Biol. 22 611–618. 10.1016/j.chembiol.2015.04.012 - DOI - PubMed
    1. Drees S. L., Li C., Prasetya F., Saleem M., Dreveny I., Williams P., et al. (2016). PqsBC, a condensing enzyme in the biosynthesis of the Pseudomonas aeruginosa quinolone signal: crystal structure, inhibition, and reaction mechanism. J. Biol. Chem. 291 6610–6624. 10.1074/jbc.M115.708453 - DOI - PMC - PubMed
    1. Dulcey C. E., Dekimpe V., Fauvelle D.-A., Milot S., Groleau M.-C., Doucet N., et al. (2013). The end of an old hypothesis: the Pseudomonas signaling molecules 4-hydroxy-2-alkylquinolines derive from fatty acids, not 3-ketofatty acids. Chem. Biol. 20 1481–1491. 10.1016/j.chembiol.2013.09.021 - DOI - PMC - PubMed