. 2017 May 24:8:866.
doi: 10.3389/fpls.2017.00866. eCollection 2017.

Katanin Effects on Dynamics of Cortical Microtubules and Mitotic Arrays in Arabidopsis thaliana Revealed by Advanced Live-Cell Imaging

Affiliations

Katanin Effects on Dynamics of Cortical Microtubules and Mitotic Arrays in Arabidopsis thaliana Revealed by Advanced Live-Cell Imaging

George Komis et al. Front Plant Sci. .

Abstract

Katanin is the only microtubule severing protein identified in plants so far. Previous studies have documented its role in regulating cortical microtubule organization during cell growth and morphogenesis. Although, some cell division defects are reported in KATANIN mutants, it is not clear whether or how katanin activity may affect microtubule dynamics in interphase cells, as well as the progression of mitosis and cytokinesis and the orientation of cell division plane (CDP). For this reason, we characterized microtubule organization and dynamics in growing and dividing cotyledon cells of Arabidopsis ktn1-2 mutant devoid of KATANIN 1 activity. In interphase epidermal cells of ktn1-2 cortical microtubules exhibited aberrant and largely isotropic organization, reduced bundling and showed excessive branched microtubule formation. End-wise microtubule dynamics were not much affected, although a significantly slower rate of microtubule growth was measured in the ktn1-2 mutant where microtubule severing was completely abolished. KATANIN 1 depletion also brought about significant changes in preprophase microtubule band (PPB) organization and dynamics. In this case, many PPBs exhibited unisided organization and splayed appearance while in most cases they were broader than those of wild type cells. By recording PPB maturation, it was observed that PPBs in the mutant narrowed at a much slower pace compared to those in Col-0. The form of the mitotic spindle and the phragmoplast was not much affected in ktn1-2, however, the dynamics of both processes showed significant differences compared to wild type. In general, both mitosis and cytokinesis were considerably delayed in the mutant. Additionally, the mitotic spindle and the phragmoplast exhibited extensive rotational motions with the equatorial plane of the spindle being essentially uncoupled from the division plane set by the PPB. However, at the onset of its formation the phragmoplast undergoes rotational motion rectifying the expansion of the cell plate to match the original cell division plane. Conclusively, KATANIN 1 contributes to microtubule dynamics during interphase, regulates PPB formation and maturation and is involved in the positioning of the mitotic spindle and the phragmoplast.

Keywords: Arabidopsis; cell division; interphase; katanin; live imaging; microtubules; preprophase band; super resolution microscopy.


Figures
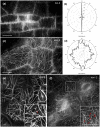
Figure 1
Figure 1
Cortical microtubule organization in petiole and cotyledon epidermal cells of Col-0 and ktn1-2 mutant expressing a GFP-TUA6 microtubule marker after SIM 2D imaging. (a,b) Prevalent transverse orientation of cortical microtubules in Col-0 petiole epidermal cells (a) shown by very narrow angular distribution (b). (c,d) Mixed orientation of cortical microtubules in ktn1-2 petiole epidermal cells (c) and its quantitative demonstration (d). (e,f) Cortical microtubule organization in the cotyledon of Col-0 (e) showing a single branching event (inset; arrow) and ktn1-2 (f) showing multiple de novo branched initiation and formation of microtubules (f; arrows; inset). Scale bars: 10μm.
Figure 2
Figure 2
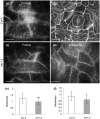
Microtubule skewness in Col-0 and ktn1-2 petiole and cotyledon epidermal cells expressing a GFP-TUA6 microtubule marker after SIM 2D imaging. (a–d) Examples of microtubule organization in petiole (a,c) and cotyledon (b,d) epidermal cells of Col-0 (a,b) and ktn1-2 (c,d). (e) Skewness of petiole epidermal cells of Col-0 and ktn1-2 (***p < 0.001; N = 49 cells for Col-0 and N = 34 for ktn1-2). (f) Skewness of cotyledon epidermal cells of Col-0 and ktn1-2 (*p < 0.05; N = 28 cells for Col-0 and N = 26 for ktn1-2). Scale bars: 10 μm.
Figure 3
Figure 3
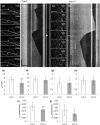
Time lapsed 2D imaging of cotyledon epidermal cell cortical microtubules by CLSM and quantitative analysis of end-wise dynamics in Col-0 and ktn1-2 mutant, stably expressing a GFP-TUA6 microtubule marker. (a,b) A single microtubule from Col-0 exhibiting dynamic instability from the plus end (a, arrowhead) and the respective kymograph (b) with annotations of plus (+) and minus (−) ends. (c,d) An individual microtubule (c, arrowhead) from ktn1-2 showing dynamic instability and the respective kymograph (d) with annotations of plus (+) and minus (−) ends. (e–h) Quantification of average values (± S.D) of plus end growth (e, n = 40 and 36 for Col-0 and ktn1-2, respectively; ***p < 0.001), shrinkage (f, n = 39 and 40 for Col-0 and ktn1-2, respectively), and minus end growth (g, n = 18 and 14 for Col-0 and ktn1-2, respectively) and shrinkage (h, n = 26 and 25 for Col-0 and ktn1-2, respectively). (i,j) Catastrophe (i, ***p < 0.001) and rescue (j, *p < 0.05) frequencies (mean ± S.D) comparing Col-0 and ktn1-2 (n = 39 microtubules for Col-0 and n = 40 microtubules for ktn1-2). These and other microtubule dynamics parameters can be found in Table 1. Scale bars: 10 μm (a–c) 5 μm (d); Time bars: 1 min (b), 2 min (d). Numbers in (a,c) correspond to time (min:s).
Figure 4
Figure 4
Recording of severing events in Col-0 and ktn1-2 petiole epidermal cells expressing a GFP-TUA6 microtubule marker with time-lapsed 2D SIM. The spotted appearance of microtubules owes to the inhomogeneous incorporation of TUA6-GFP in the microtubule lattice (a,b; see Section Discussion by Komis et al., 2014). Time lapsed stills of petiole epidermal cell region showing severing in Col-0 (a) and absence of severing in ktn1-2 (b). (c) Quantitative comparison of severing frequencies in petiole epidermal cells of Col-0 and ktn1-2 (***p < 0.001; N = 19 cells from Col-0 and N = 16 cells from ktn1-2). Severing frequencies can be found in Table 1. Arrows in (a) show microtubule crossover in first 2 frames and the microtubule ends resulting from severing in the rest of the frames. In (b) arrows in first frame show 3 microtubule crossovers where no severing is observed. Scale bars: 2 μm. Numbers at (a,b) correspond to time (s.ms).
Figure 5
Figure 5
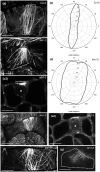
PPB organization and MT anisotropy in Col-0 and ktn1-2 mutants expressing a GFP-TUA6 microtubule marker. Single optical sections were acquired with Airyscan CLSM (a,c,e,f) and SIM (g). (a) Typical early PPB (brackets) of Col-0 dividing petiole epidermal cell showing roughly parallel and homogeneous distribution of microtubules. (b) Angular distribution of microtubules in PPB of (a) showing a rather uniform transverse orientation. (c1,c2) Early PPB of ktn1-2 petiole epidermal cell at surface (c1) and mid (c2) planes, showing a well-focused side and a much broader microtubule distribution on opposite side (c1,c2 brackets) with long microtubules emanating from the PPB to the rest of the cortex. Scanning time was 4.28 min for the entire Z-stack while a rotating panoramic view can be found in Video S1. (d) Angular distribution of microtubules in PPB of (c1) showing much broader orientation than in (a) although with a transverse orientation trend. (e–g) More examples of abnormal PPB organization in ktn1-2 including a fan-shaped PPB at surface (e1) and at middle (e2; asterisk denotes position of nucleus optical planes), a broad, disordered (f) and an incomplete one (g). Asterisk in (c2) and (e2) indicates position of nucleus. Scanning time was 3.74 min for (e1,e2) and 17.8 s for (f); (g) is a single optical section Scale bars: 5 μm.
Figure 6
Figure 6
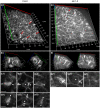
Completeness of Col-0 and ktn1-2 PPB in the three dimensions as visualized in cotyledon epidermal cells expressing a GFP-TUA6 microtubule marker after Z-optical sectioning and 3D reconstruction (a,b,e,f) or after single optical section imaging (c,d,g) using spinning disc microscopy. (a,b) Overview (a) and higher magnification (b) of Col-0 cotyledon epidermis showing two adjacent cells with well-organized and complete PPBs at two different rotation angles. These cells are shown in a rotating panoramic view at Video S2. (c,d) Top (c1,d1), middle (c2,d2), and bottom (c3,d3) views of the PPBs shown in (b). (e,f) Overview (e) and detail (f) of aberrant PPB formation in ktn1-2 mutant at two different rotation angles. The same cell is shown in a rotating panoramic view at Video S3. (g) Top (g1), middle (g2), and bottom (g3) views of the ktn1-2 PPB shown in (f). Red arrows in (a,e) denote PPBs. Asterisks in (c2,d2,g2) denote nuclear position. Arrowheads in (c,d,g) denote the PPBs. For all Z-acquisitions shown herein, total scanning time was between 45 s (a–d3) to 75 s (e–g3). Scale bars: 5 μm.
Figure 7
Figure 7
Documentation and quantitation of PPB narrowing in dividing cells of Col-0 and ktn1-2 mutant expressing a GFP-TUA6 microtubule marker after spinning disc time-lapse 2D imaging. (a) Selected stills from the Video S4, showing the progressive narrowing of the PPB (arrowheads) in a Col-0 epidermal cell until entry in mitosis. (b) Selected stills from the Videos S5, S6 (continuation of mitotic progress of this cell is shown in Figure 9b), showing the progressive narrowing of the PPB (brackets) in a ktn1-2 epidermal cell until entry in mitosis. (c) Line graph following the course of PPB narrowing by comparison between a Col-0 and a ktn1-2 cell, showing significant delay in the latter. Interruptions in the lines correspond to interruptions in the recordings. (d) Averaged kinetic documentation of PPB narrowing (N = 6–7 cells from a total of 5 plants) showing significant delay of PPB narrowing in the ktn1-2 mutant (***p < 0.001). Scale bars: 10 μm. Numbers in (a,b) correspond to time (min).
Figure 8
Figure 8
Mitotic and cytokinetic forms in Col-0 and ktn1-2 mutant expressing a GFP-TUA6 microtubule marker after Airyscan CLSM (a,b) and SIM (c–g) imaging of single optical sections (b1,b2,c–g) or after 3D reconstruction (a,b3). (a) Typical prophase spindle in Col-0. (b) A typical bipolar metaphase spindle of ktn1-2 which is formed in the presence of a broad PPB (brackets, b1,b2) at the cell cortex and a 3D rendered image of the same cell (b3) which corresponds to a panoramic 3D rotation of Video S7. Scanning time of the entire Z-stack (93 sections) was 5.9 min. (c) Typical phragmoplast of Col-0 (arrowheads). (d) An oblique phragmoplast of ktn1-2 (arrowheads). (e) An advanced phragmoplast (arrowheads) of ktn1-2 progressing asymmetrically toward the parent wall. (f) A similarly asymmetric phragmoplast of ktn1-2 showing “arrowhead” configuration (arrowheads). (g) A shorter, advanced ktn1-2 phragmoplast again with “arrowhead” configuration (arrowheads). All scale bars: 10 μm.
Figure 9
Figure 9
Mitotic and cytokinetic progression in Col-0 and ktn1-2 petiole epidermal cells expressing a GFP-TUA6 microtubule marker, after spinning disc 3D time-lapsed imaging. (a) Transition from PPB to spindle and finally to phragmoplast formation and expansion in two dividing Col-0 petiole epidermal cells. Corresponds to Video S8. (b) Microtubule reorganization from PPB to spindle and to phragmoplast in a dividing ktn1-2 petiole epidermal cell showing significant delay in phragmoplast expansion. Corresponds to Video S6 (showing continuation of mitotic progress in cell shown in Figure 7b). (c) Delayed phragmoplast expansion and bending in ktn1-2. Corresponds to Video S9. (d–g) Quantitative evaluation of mitotic progression comparing Col-0 and ktn1-2, showing duration of mitosis with significant delay of ktn1-2 (d; **p < 0.01; N = 20 for Col-0 and N = 45 for ktn1-2), cytokinesis (e; ***p < 0.001; N = 20 for Col-0 and N = 45 for ktn1-2), distance covered during expansion of phragmoplast (f; **p < 0.01; N = 20 for Col-0 and N = 45 for ktn1-2) and rate of phragmoplast expansion (g; **p < 0.01; N = 20 for Col-0 and N = 45 for ktn1-2). Scale Bars: (a–c) 10 μm, (h–j) 5 μm. Numbers in (a,b) correspond to time (min). Time required for an entire Z-stack was 8.6 s for (a), 7.1 s for (b), and 8.3 s for (c).
Figure 10
Figure 10
Mitotic and cytokinetic progression in Col-0 and ktn1-2 cotyledon epidermal cells expressing a GFP-TUA6 microtubule marker after Airyscan CLSM imaging. (a) Mitotic spindle and phragmoplast dynamics in Col-0. Mitotic spindle is positioned so that the equatorial plane (yellow line) coincides with the PPB plane (red arrowheads) while the spindle axis (red line) is perpendicular to it. Both the spindle equator and the cell plate (yellow lines) remain coaligned to the CDP. Sometimes the phragmoplast reaches the parent wall asymmetrically creating a stable contact (green arrowhead) while the remaining leading edge (magenta arrowhead) still follows the trajectory predetermined by the PPB. (b) In ktn1-2 the mitotic spindle equator (yellow line) is not adhering to the predetermined CDP (red arrowheads) and the spindle rotates significantly (spindle axis indicated by red line). Subsequently the nascent phragmoplast rotates as well until one end is attracted and tethered to the parent wall (green arrowhead). After this positional correction, the phragmoplast leading edge (magenta arrowhead) strictly follows the plane determined by the PPB so that the cell plate will coincide with the predetermined CDP. It is notable that progressively microtubules at the phragmoplast margin assume the “arrowhead” configuration as shown before (frames 80 and 96 min; Panteris et al., 2011). Scale Bars: 5 μm. Numbers in (a,b) correspond to time (min:s).
Figure 11
Figure 11
A simplified schematic model explaining the defects of KATANIN 1 depletion in cell growth, PPB formation, and mitotic spindle positioning according to published and present data. KATANIN 1 severs microtubules after branched formation (Nakamura et al., 2010), at microtubule crossovers (Wightman and Turner, 2007) apart from severing free microtubules. Through its activity, KATANIN 1 promotes the biased organization of microtubules at different stages of plant cell cycle. In interphase cells, KATANIN 1 microtubule severing induces parallel arrangement of cortical microtubules and supports unidirectional cell growth while in its absence as it occurs in ktn1-2 mutant, cortical microtubule arrays remain disordered and result in isotropic cell growth. During PPB formation, KATANIN 1 severing activity promotes microtubule organization and confinement to the PPB zone while it is implicated in PPB narrowing. PPB formation and its course of maturation are impaired in ktn1-2. Finally, during mitosis, KATANIN 1 activity is related to mitotic spindle positioning by securing co-alignment of the equatorial plane with the CDP without affecting spindle formation, while in its absence the spindle exhibits considerable motions and appears to freely rotate in the cytoplasm. This model differs from that of Panteris et al. (2011) in that it appoints spindle rotation in KATANIN 1 mutants such as ktn1-2 to a continuous dynamic process rather than attributing it to structural deficits caused during spindle formation (spindle multipolarity).

Similar articles

Cited by

References

    1. Azimzadeh J., Nacry P., Christodoulidou A., Drevensek S., Camilleri C., Amiour N., et al. . (2008). Arabidopsis TONNEAU1 proteins are essential for preprophase band formation and interact with centrin. Plant Cell 20, 2146–2159. 10.1105/tpc.107.056812 - DOI - PMC - PubMed
    1. Beck M., Komis G., Müller J., Menzel D., Samaj J. (2010). Arabidopsis homologs of nucleus- and phragmoplast-localized kinase 2 and 3 and mitogen-activated protein kinase 4 are essential for microtubule organization. Plant Cell 22, 755–771. 10.1105/tpc.109.071746 - DOI - PMC - PubMed
    1. Beck M., Komis G., Ziemann A., Menzel D., Samaj J. (2011). Mitogen-activated protein kinase 4 is involved in the regulation of mitotic and cytokinetic microtubule transitions in Arabidopsis thaliana. New Phytol. 189, 1069–1083. 10.1111/j.1469-8137.2010.03565.x - DOI - PubMed
    1. Blancaflor E. B., Hasenstein K. H. (1993). Organization of cortical microtubules in graviresponding maize roots. Planta 191, 231–237. - PubMed
    1. Blancaflor E. B., Hasenstein K. H. (1995a). Growth and microtubule orientation of Zea mays roots subjected to osmotic stress. Int. J. Plant Sci. 156, 774–783. 10.1086/297301 - DOI - PubMed

LinkOut - more resources