

Comparative Analysis of Tongue Indices between Patients with and without a Self-Reported Yin Deficiency: A Cross-Sectional Study
- PMID: 28596793
- PMCID: PMC5449755
- DOI: 10.1155/2017/1279052
Comparative Analysis of Tongue Indices between Patients with and without a Self-Reported Yin Deficiency: A Cross-Sectional Study
Abstract
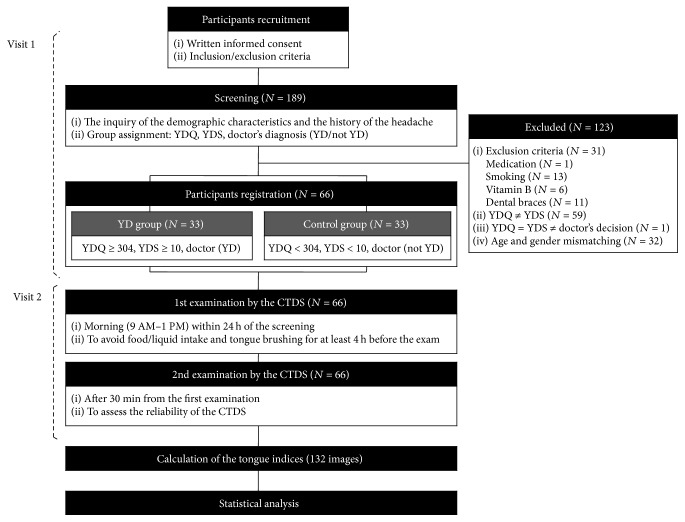
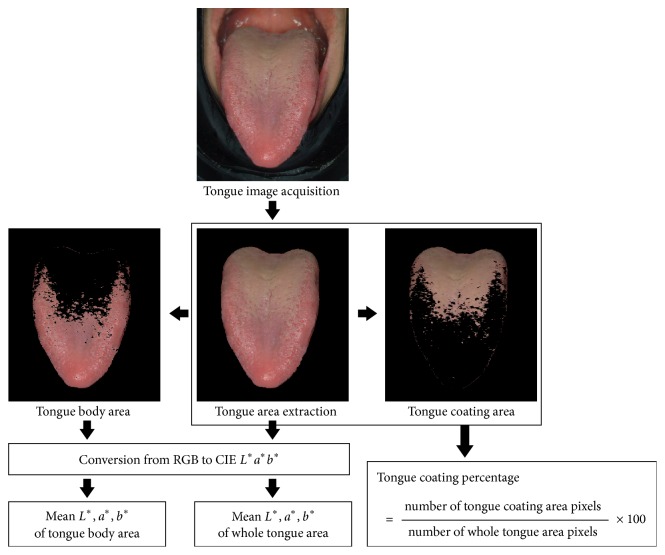
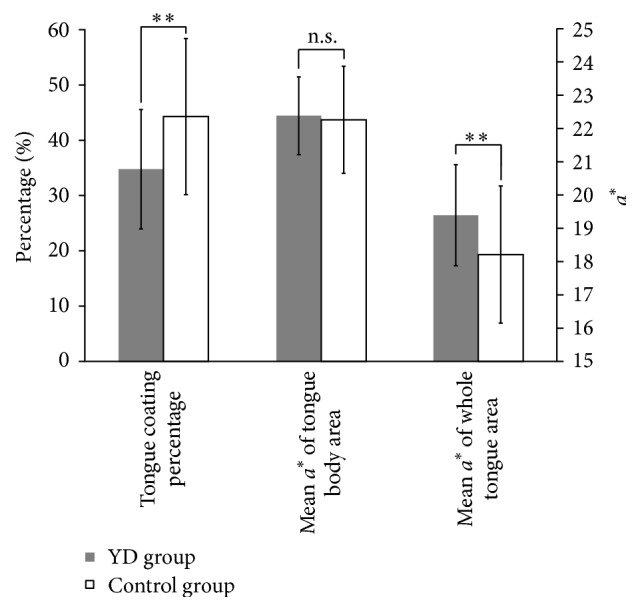
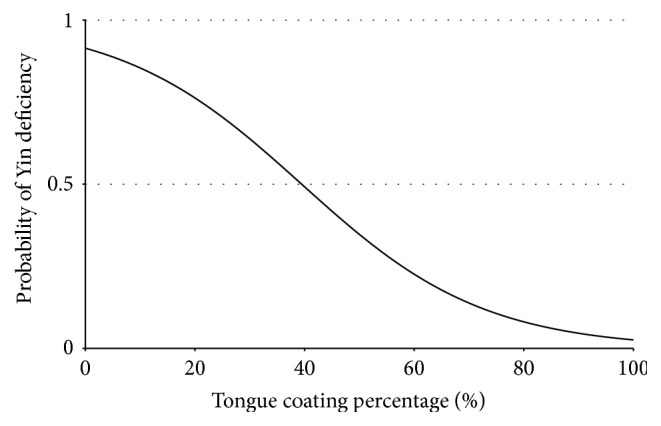
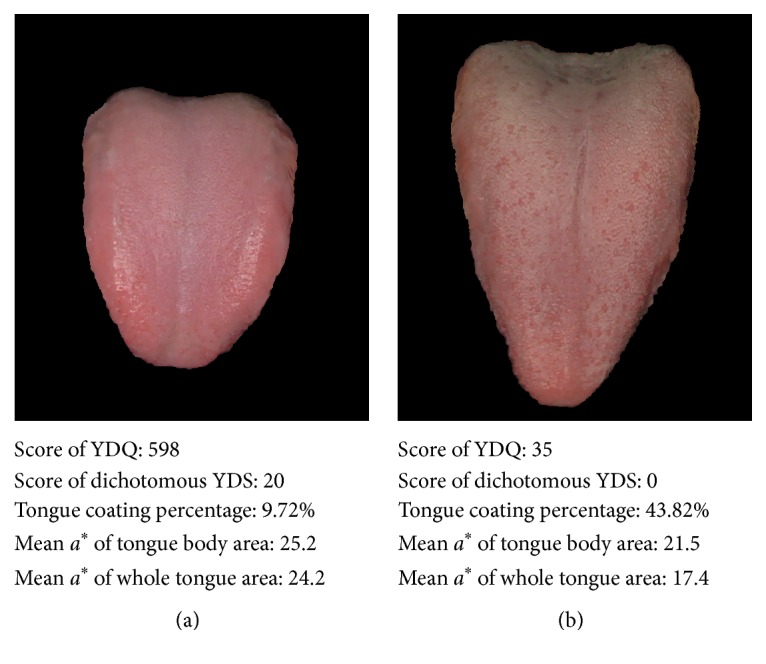
We investigated the hypothesis that Yin-deficient patients have a reddened tongue with less coating. We screened 189 participants aged 20 to 49 years, complaining of headache. To classify patients in terms of Yin deficiency, we used two self-reporting Yin-deficiency questionnaires (Yin-Deficiency Questionnaire and Yin-Deficiency Scale) and diagnosis by a doctor. Based on the tests, a total of 33 subjects were assigned to a Yin-deficient group and 33 subjects were assigned to a nondeficient control group. Tongue images were acquired using a computerized tongue diagnostic system, for evaluating tongue indices. The tongue coating percentage and tongue redness were calculated as the mean a⁎ value of both the whole tongue area (WT a⁎) and the tongue body area (TB a⁎). The tongue coating percentage of the Yin-deficient group (34.79 ± 10.76) was lower than that of the nondeficient group (44.13 ± 14.08). The WT a⁎ value of the Yin-deficient group (19.39 ± 1.52) was significantly higher than that of the nondeficient group (18.21 ± 2.06). However, the difference in the TB a⁎ value between the two groups was not significant. In conclusion, we verified that Yin-deficient patients had less tongue coating and tended to have a more reddish tongue than nondeficient patients.
Figures
Similar articles
-
[Study on the mechanism of denuded tongue coating due to yin deficiency].Zhong Xi Yi Jie He Za Zhi. 1989 Mar;9(3):153-5, 133. Zhong Xi Yi Jie He Za Zhi. 1989. PMID: 2736699 Chinese.
-
A New Method for Syndrome Classification of Non-Small-Cell Lung Cancer Based on Data of Tongue and Pulse with Machine Learning.Biomed Res Int. 2021 Aug 11;2021:1337558. doi: 10.1155/2021/1337558. eCollection 2021. Biomed Res Int. 2021. PMID: 34423031 Free PMC article.
-
The distribution of Yin-Deficient symptoms and their relationship on survival rate in cancer patients with Yin-Deficiency.Am J Chin Med. 2008;36(4):655-63. doi: 10.1142/S0192415X08006120. Am J Chin Med. 2008. PMID: 18711763
-
[Clinical and experimental study of the effect of compound five-shen herbal drink in the treatment of acute febrile diseases with damage to the yin and reddened tongue syndrome].Zhong Xi Yi Jie He Za Zhi. 1989 Oct;9(10):583-6, 579. Zhong Xi Yi Jie He Za Zhi. 1989. PMID: 2691106 Clinical Trial. Chinese.
-
[Tongue temperature of healthy persons and patients with yin deficiency by using thermal video].Zhong Xi Yi Jie He Za Zhi. 1990 Dec;10(12):732-3, 709. Zhong Xi Yi Jie He Za Zhi. 1990. PMID: 2292119 Chinese.
Cited by
-
Advances in automated tongue diagnosis techniques.Integr Med Res. 2019 Mar;8(1):42-56. doi: 10.1016/j.imr.2018.03.001. Epub 2018 Mar 8. Integr Med Res. 2019. PMID: 30949431 Free PMC article. Review.
-
Association between tongue coating thickness and ultraviolet fluorescence in patients with functional dyspepsia: A prospective observational study.Medicine (Baltimore). 2019 Jul;98(28):e16106. doi: 10.1097/MD.0000000000016106. Medicine (Baltimore). 2019. PMID: 31305393 Free PMC article.
-
Circadian Rhythms in Tongue Features.J Clin Med. 2024 Jun 17;13(12):3549. doi: 10.3390/jcm13123549. J Clin Med. 2024. PMID: 38930077 Free PMC article.
-
A Framework to Predict Gastric Cancer Based on Tongue Features and Deep Learning.Micromachines (Basel). 2022 Dec 25;14(1):53. doi: 10.3390/mi14010053. Micromachines (Basel). 2022. PMID: 36677112 Free PMC article.
-
The Herbal Formula CWBSD Improves Sleep Quality Dependent on Oral Microbial Type and Tongue Diagnostic Features in Insomnia.J Pers Med. 2021 Apr 21;11(5):325. doi: 10.3390/jpm11050325. J Pers Med. 2021. PMID: 33919176 Free PMC article.
References
-
- Lee B., Park Y., Kim T. Diagnosis in Traditional Korean Medicine. Seoul, Republic of Korea: Seongbosa; 2000.
-
- WHO Regional Office for the Western Pacific. Standard Terminologies on Traditional Medicine in the Western Pacific Region. Manila, Philippines: Renouf Publishing Co Ltd.; 2007.
-
- Chen Z. L., Hu Q. F. Recent development in research on tongue inspection. Chinese Medical Journal. 1986;99(6):444–456. - PubMed
-
- Zhang S. Q. Tongue temperature of healthy persons and patients with Yin deficiency by using thermal video. Chinese Journal of Modern Developments in Traditional Medicine. 1990;10(12):732–733. - PubMed
LinkOut - more resources
Full Text Sources
Other Literature Sources
